The full version of the study is available at the link: Medium
Hey there, DAO!
Despite the direction of long-term development of ENS, it is necessary to detect, understand and solve marketing problems. The question is not only about money and investment attractiveness, but also about mass adoption of both the industry in general and the Ethereum infrastructure in particular.
Approximately half a year ago, I observed a significant diminution in consumer engagement with ENS’s principal offering, namely web3 names. Intrigued by the attributes and underlying causative factors of this decline, I embarked on an econometric investigation, the comprehensive details of which are accessible via the aforementioned hyperlink.
Herein, I present a concise synopsis of the study.
Trend
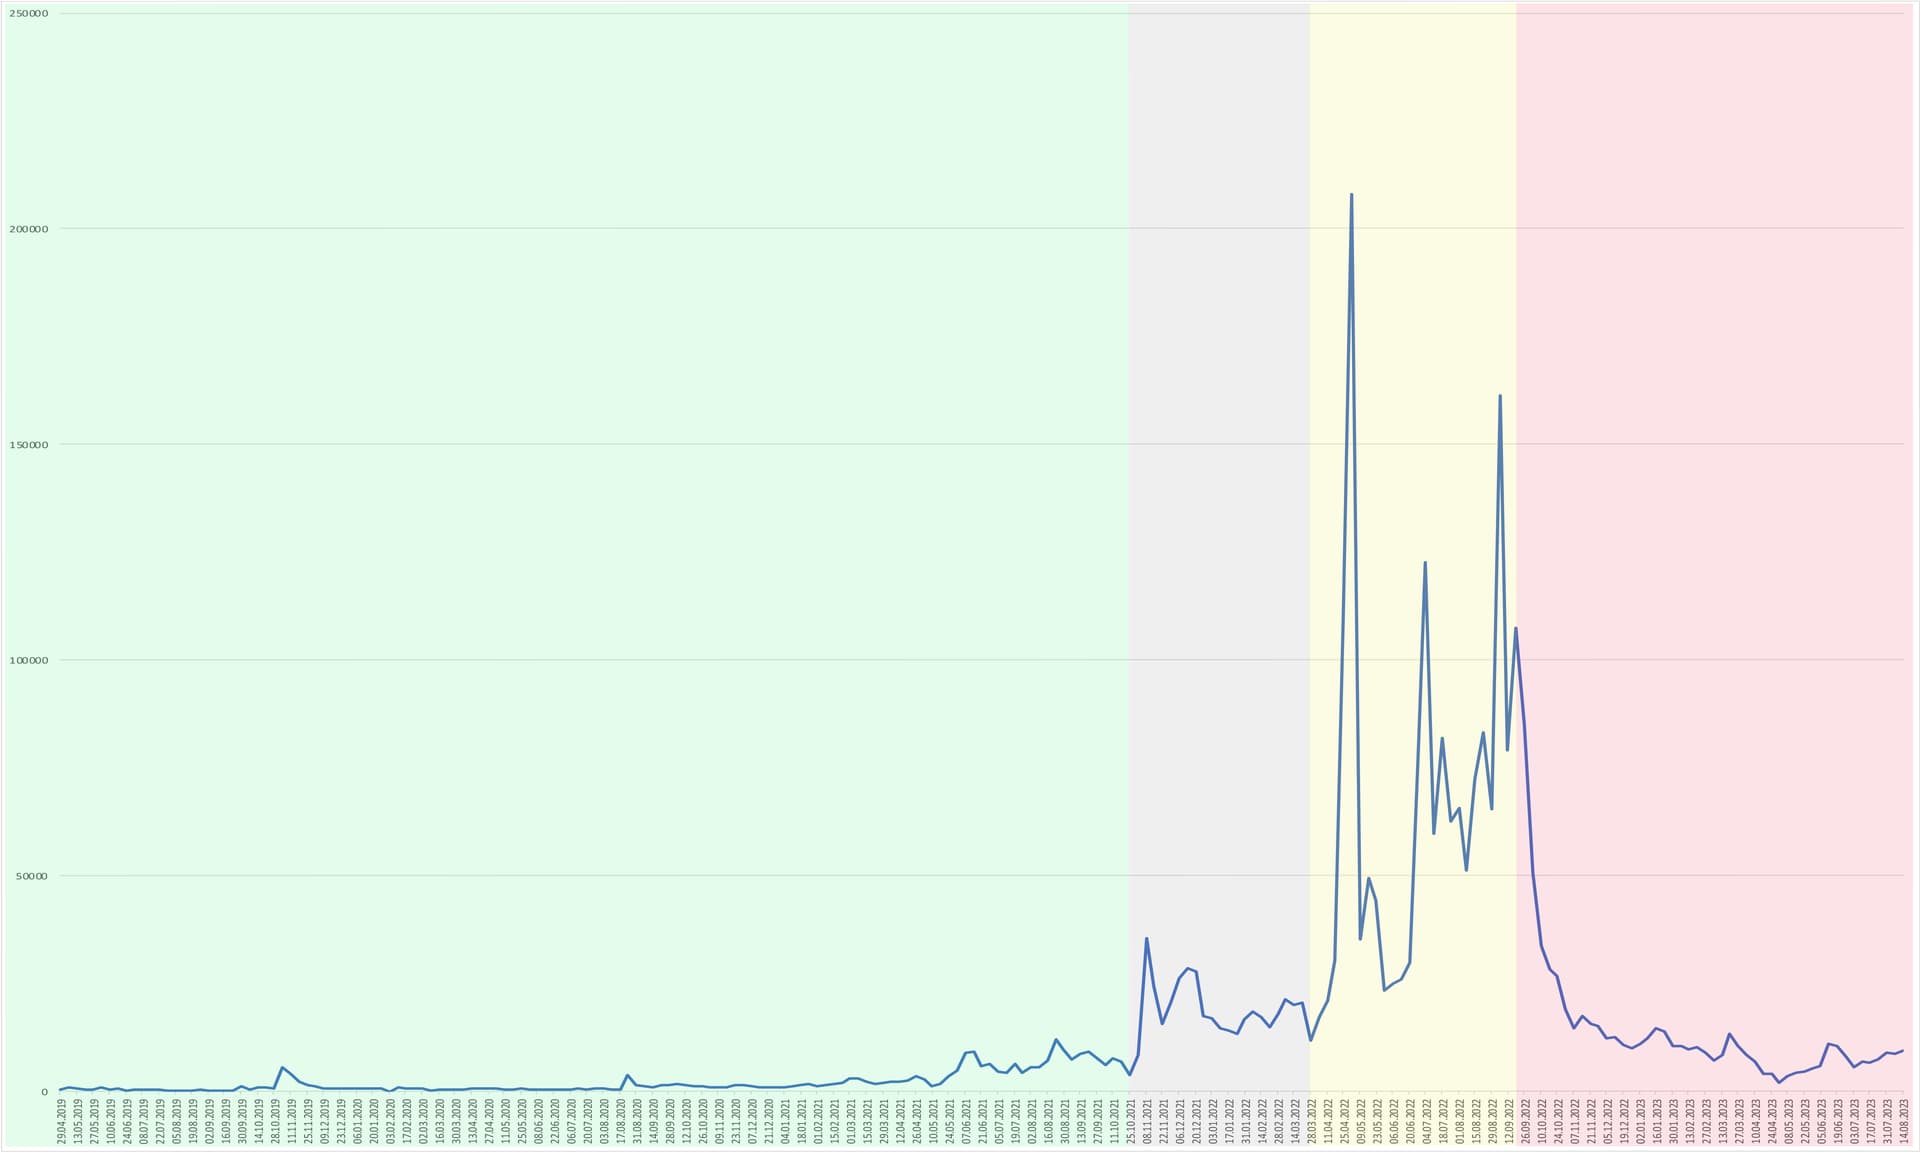
Initially, it was imperative to ascertain whether the observed decline conformed to the mathematical definition of a ‘downtrend.’ To achieve this, I employed autoregressive analytical techniques and statistical hypothesis testing, ultimately confirming the existence of a localized downtrend spanning nearly a year (48 months).
The salient features of this downward trajectory are as follows:
-
It is monotonically decreasing, signifying that the decline exhibits a consistent structure and, barring infrequent anomalies, persisted throughout the period under scrutiny.
-
The trend is characterized by a logarithmic configuration, implying that its impact was most pronounced during the initial phases and subsequently exhibited diminishing marginal effects. This is advantageous for us, as within the confines of this model, it is unwarranted to anticipate increasingly severe declines. Any uptick in sales would either attenuate the monotonicity of the trend or signify its dissolution, heralding the onset of a new localized upward trajectory.
-
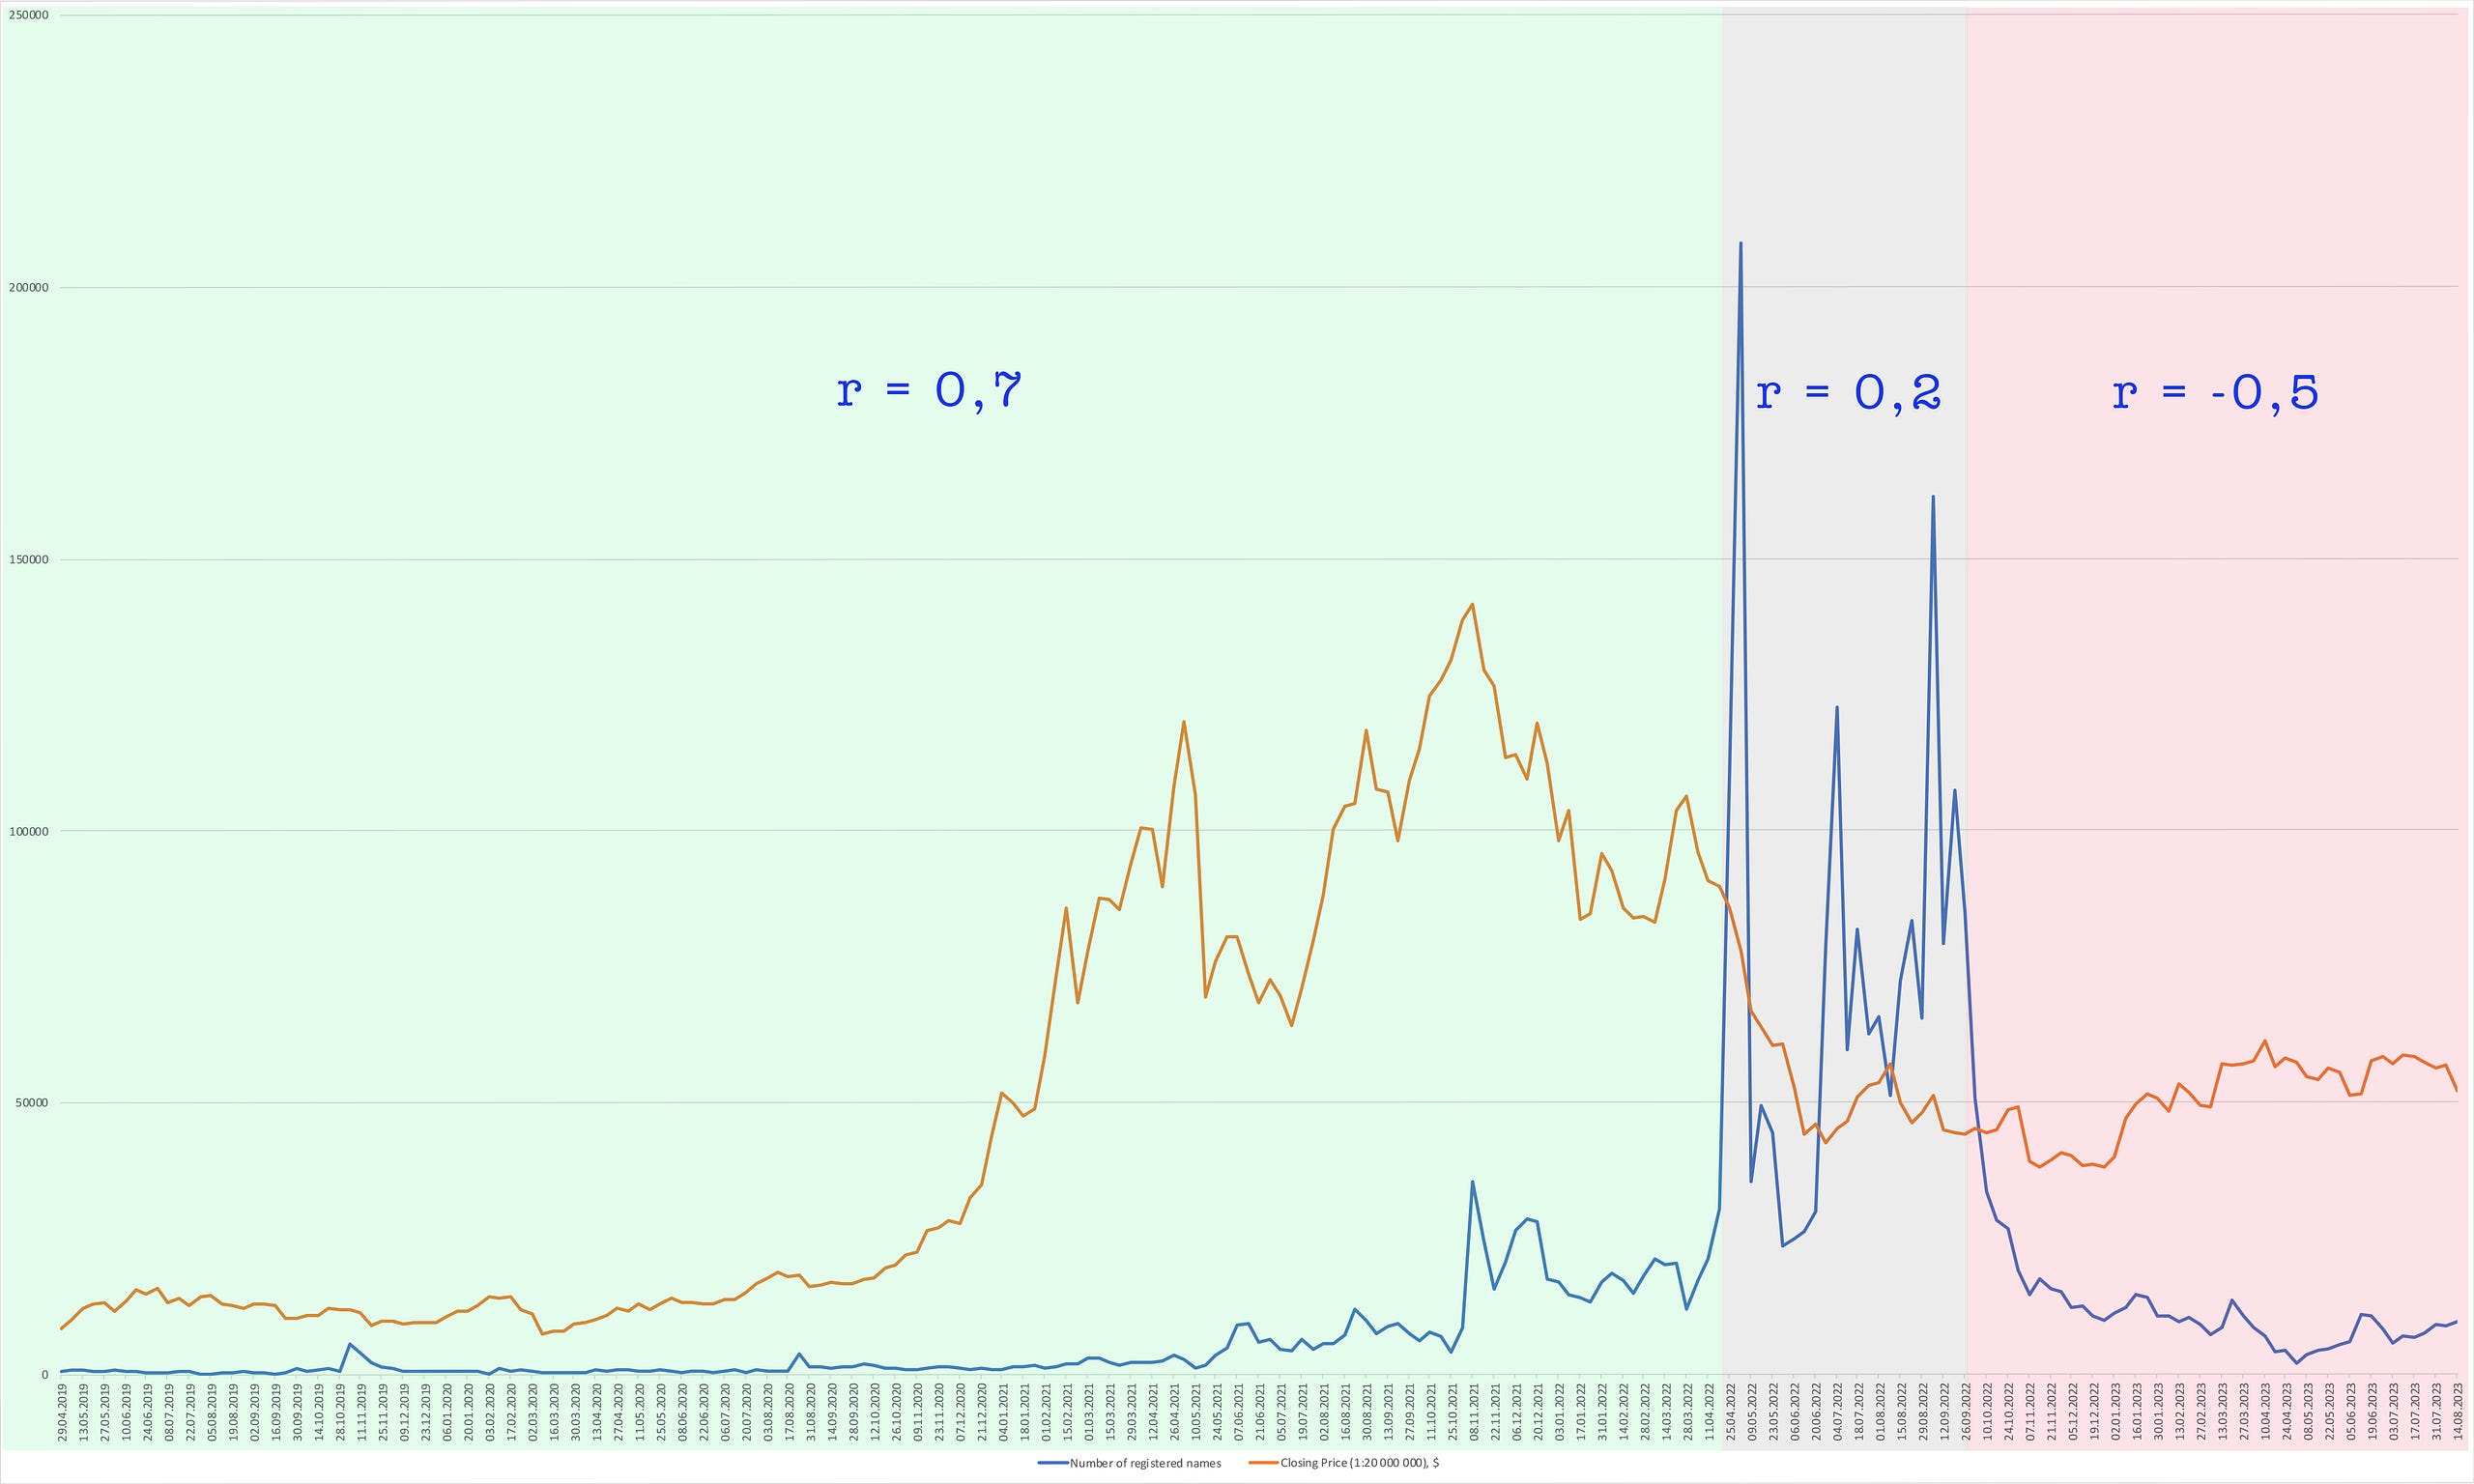
The localized downtrend exerts a moderating influence on the overarching positive trend. While it is premature to entirely dismiss the global hypothesis positing a long-term increase in sales, the nature of the global trend has undeniably shifted. Prior to the recession, it could be described as monotonically increasing, robust, and positive; post-recession, it has transitioned to a non-monotonic, attenuated, albeit still positive, state.
In the visualization you can see the segmentation that I gave as an example of what the long-term local trends were. Green marks the period when we were certainly growing monotonously. Gray - when we moved without a trend. Yellow – when the trend was not monotonous, but we were still moving up. Red – the current, pronounced, monotonous downtrend.
Within the context of the delineated challenges, a pivotal query necessitated exploration: Is the observed phenomenon an unprecedented occurrence, or could analogous patterns have manifested previously? Given that the subject under investigation pertains to the performance metrics of an economic entity, the potential for seasonal fluctuations in user engagement could not be discounted.
Seasonality
To scrutinize the element of seasonality, autocorrelation analysis was employed. This analytical modality facilitates the examination of temporal correlations within distinct segments of a time series.
In the course of evaluating the autocorrelation function, a hypothesis was posited: Should the data exhibit recurrent patterns at intervals of approximately 48 weeks, the current sales contraction could be attributed entirely to seasonal variations. If, however, the cyclical nature of the data is of a lesser magnitude, a partial attribution to seasonality could be considered.
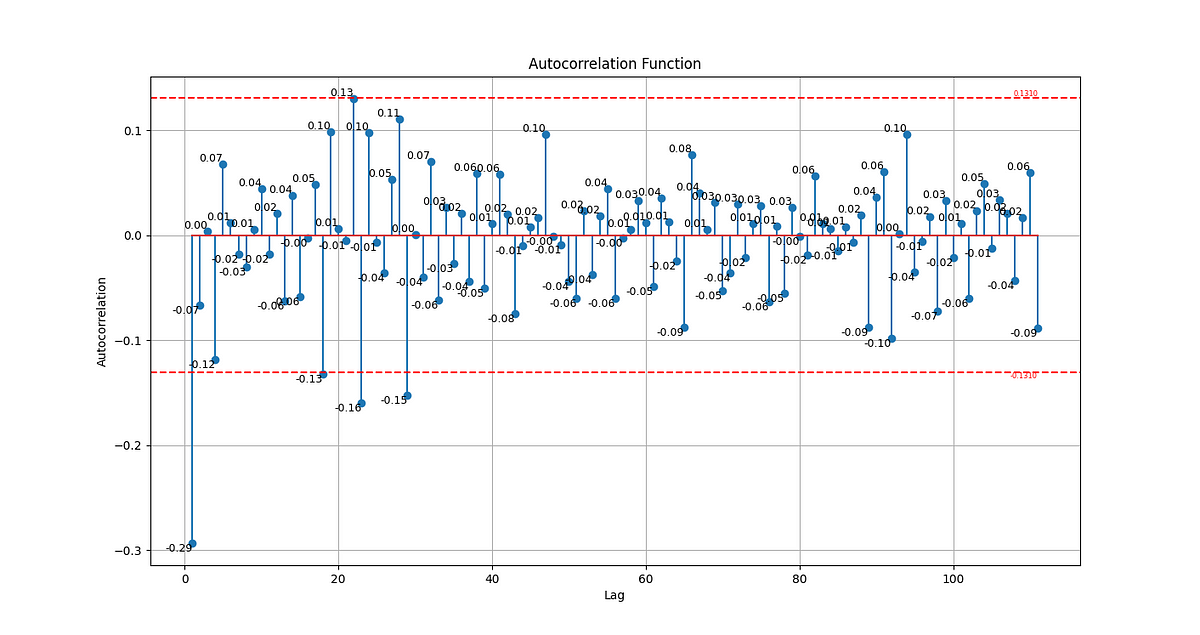
The empirical analysis divulged that sales of names do exhibit periodicity, characterized by seasonal durations of 18, 23, and 29 weeks. Nonetheless, the salient inquiry persists: Does this identified seasonality specifically account for the current trends?
To address this, temporal segments corresponding to the problem period and spanning 18, 23, and 29 weeks were isolated and juxtaposed against analogous segments from preceding periods. This comparison was executed via two methodologies—seasonal differentiation and correlation coefficients.
Subsequent to this analytical endeavor, it was ascertained that while seasonality exerts a general influence on ENS sales, it fails to elucidate the extant issue.
For the purpose of cross-validation, the Seasonal AutoRegressive Integrated Moving Average (SARIMA) machine learning model was deployed. A comparative analysis between the model’s forecasted values and actual data revealed a significant divergence. Had the current period been genuinely influenced by seasonal factors, the trajectory would have either maintained growth or exhibited an initial contraction followed by resumption of growth.
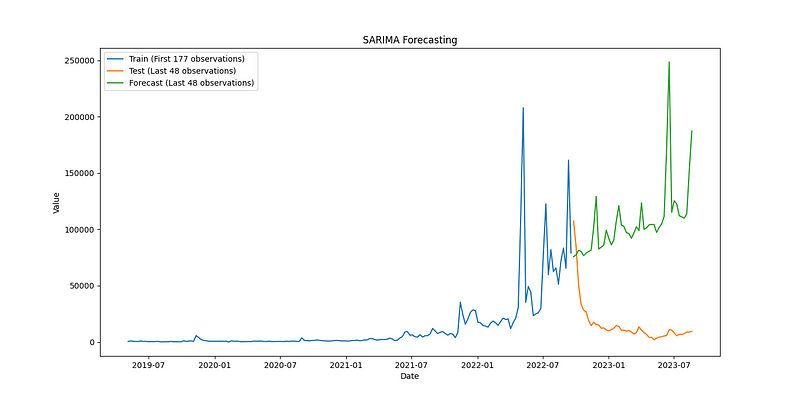
Consequently, the inference was drawn that the current decline is not attributable to autoregressive variables, at least based on the historical data presently available. This suggests the presence of additional, yet unidentified, contributory factors.
Influential variables can be broadly categorized into three distinct types: autoregressive factors, which we examined in the initial chapter, external factors, which encapsulate market-wide behaviors, and internal factors, which are reflective of the organizational activities of the company. The next segment of the research is dedicated to the examination of external determinants.
Influence of External Factors
Three metrics were selected as proxies for external quality indicators:
-
Total Market Capitalization: Despite its speculative attributes, this metric serves as a robust indicator of mass cryptocurrency adoption and generally mirrors the actual market landscape.
-
Average Daily Transactions on the Ethereum Network: This serves as a measure of specific interest in the network where ENS operates and demonstrated superior modeling performance compared to the number of active users.
-
Fees (Network Commissions + Gas): This variable directly impacts consumer purchasing decisions. Although name prices could have been incorporated into the equation, their generally stationary nature renders them less explanatory.
Regression analysis was employed as the analytical instrument to discern the extent to which sales are contingent upon these external variables. The analysis aims to elucidate the following attributes of dependency:
Temporal: External forces not always instantaneously impact marketing metrics; often, there is a lag that necessitates investigation. Understanding this temporal aspect will pragmatically inform the time required to prepare for shifts in sales levels.
Functional: The relationship between marketing metrics and external variables may not always be linear. For instance, a 10-point increase in a market indicator could correspond to a 100-point surge in company metrics, indicating a power-law relationship, or vice versa, suggesting a root relationship. Identifying the functional form of this dependency will provide insights into the expected degree of responsiveness to external stimuli.
Dynamic: The influence of external factors is unlikely to be uniform over time; it may fluctuate. The objective here is to ascertain, primarily through visual means, whether such dynamics are homogeneous.
Proportional: Employing a positivist approach in interpreting the results, I acknowledge that while my models may not be flawless, any hypothetically superior models would offer a more accurate depiction of the influence of external factors on marketing metrics. Consequently, the influence of controllable internal and autoregressive factors would be comparatively less significant. Utilizing model error descriptions, the proportionality of external influences on marketing metrics can thus be determined, along with the corresponding influence of internal and autoregressive factors.
To delineate these characteristics, a structured algorithm was employed, exemplified below in the context of sales analysis.
-
Initial Model Construction: We build the initial model based on linear multiple regression using the least squares method. In this way, we evaluate the descriptive ability of the model, the significance of the regressors-variables and the problems of the model. For sales, this stage revealed inadequacies in the model’s explanatory power, insignificant variables, and violations of model assumptions such as non-normal distribution, heteroskedasticity, first-order autocorrelation, multicollinearity, and the presence of outliers.
-
Paired Models: We build paired OLS with each of their independent variables and try to determine whether there is such a variable that pulls down the indicators and alone gives rise to any problems, and if such a variable exists, we remove it. In the case of sales, at this stage, there were no variables that stood out and we left them all.
-
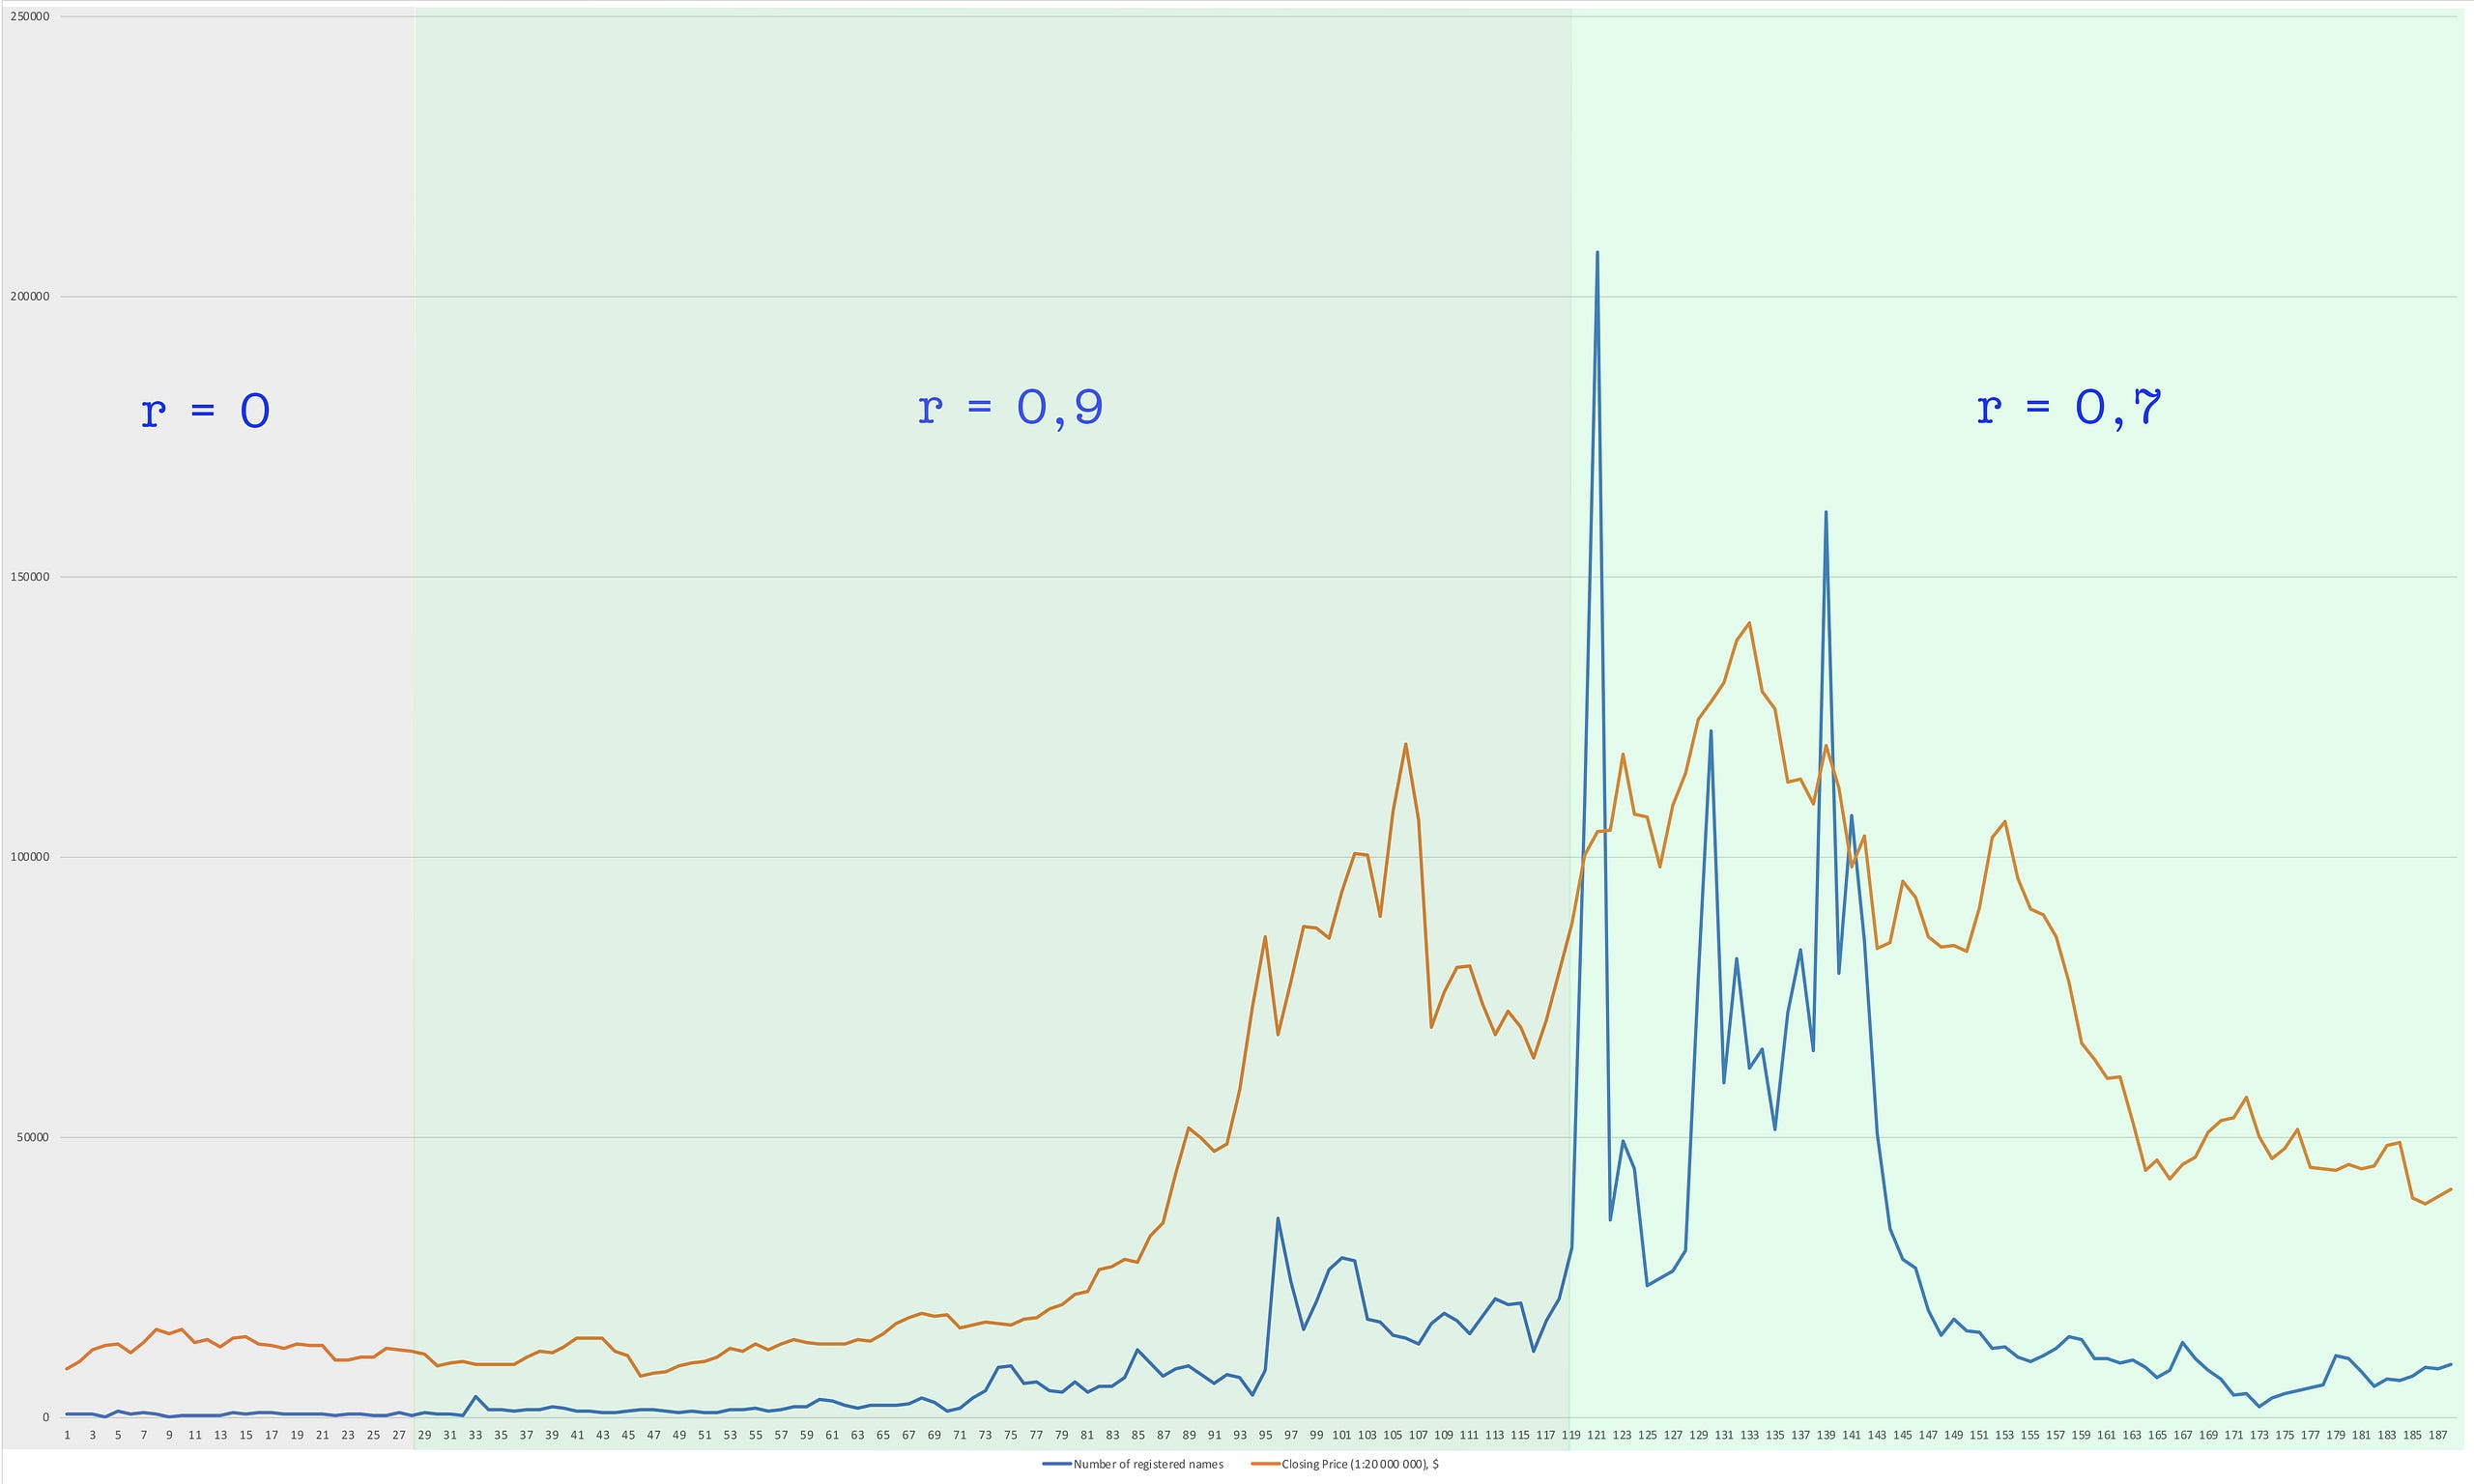
Segmentation: We perform segmentation to determine whether there may be a time period that had much better explanatory power and would still be relevant today. For example, if totalmarketcap did not explain sales for the first 50 weeks of the chart, but explained the last 175 weeks perfectly, we would not consider the first 50 weeks in the model. But if the situation were reversed, for example, the first 175 weeks did not explain anything, and the last 50 did, we would not remove anything, since this would be a loss of too much historical data. Or if the first 175 weeks were well explained, but the last 50 were not – nope, because in that case we did not describe the current situation. In the case of sales, it turned out that at some points in time external factors actually described them better, but such areas were either at the beginning or in the middle. And in the case of commissions, the model is indeed relevant, but only in the last half of the chart, so it was decided to leave it unchanged.
e.g. total market cap segmentation -
Lags: We conduct a lag analysis to determine the temporality of the dependence. We sort of shift the independent variables into the past and look at the delay with which sales react to them. Then we analyze visually and conclude whether this increase in dependence is random or systematic. For sales, it turned out that they respond to the totalmarketcap with a delay of 25-46 weeks, with an optimal delay of 37 weeks. For the number of transactions – 69 weeks. On commission - instantly, which is logical.
-
Segmentation on Shifted Data: We repeat step 3, but on shifted data, using the same principle. And here we find out that the first 28-33 weeks of the total market cap indicator (shifted by 37 weeks) only worsens the model.
e.g. total market cap segmentation (shifted, 37 weeks) -
Revised Model with Segmented and Shifted Variables: We repeat step 1, but with segmented and shifted variables. Thus, we take the sales segment Y(69)…Y(225). The “totalmarketcap” indicator is shifted by 37 weeks without the first 31 weeks, so we take X1(32)…X1(188). The transaction indicator shifted by 69 weeks, that is, X2(1)…X2(157). And the section of the commission indicator X3(69)…X3(225) simultaneous with sales. We build a model and test it for increasing explanatory power, the significance of variables and problems. In the case of sales, we actually improved the descriptiveness, but did not solve the problems and insignificance of the coefficients. We carried out the following steps with the insignificant X3 (commission) used and concluded that it only degrades the quality of the model, so we removed it at this step.
-
Addressing Model Assumptions: We solve model assumption problems by manipulating variables. First, we define a functional dependence, and transform the graph of the dependent variable using the inverse function of this dependence. In the case of sales, they have an exponential relationship, and accordingly we transform the sales graph using the natural logarithm. Then we solve the problem of multicollinearity - the dependence of the regressors on each other, using the method of principal components, combining X1 and X2. We then get rid of outliers—critical, out-of-system extreme sales values—by identifying them with Fisher’s z-test and imputation using k-nearest neighbors. After all this, we build a model and understand that all the prerequisites of the OLS method are met, except for the autocorrelation of first-order residuals, therefore we cannot use this method to interpret the relationship.
-
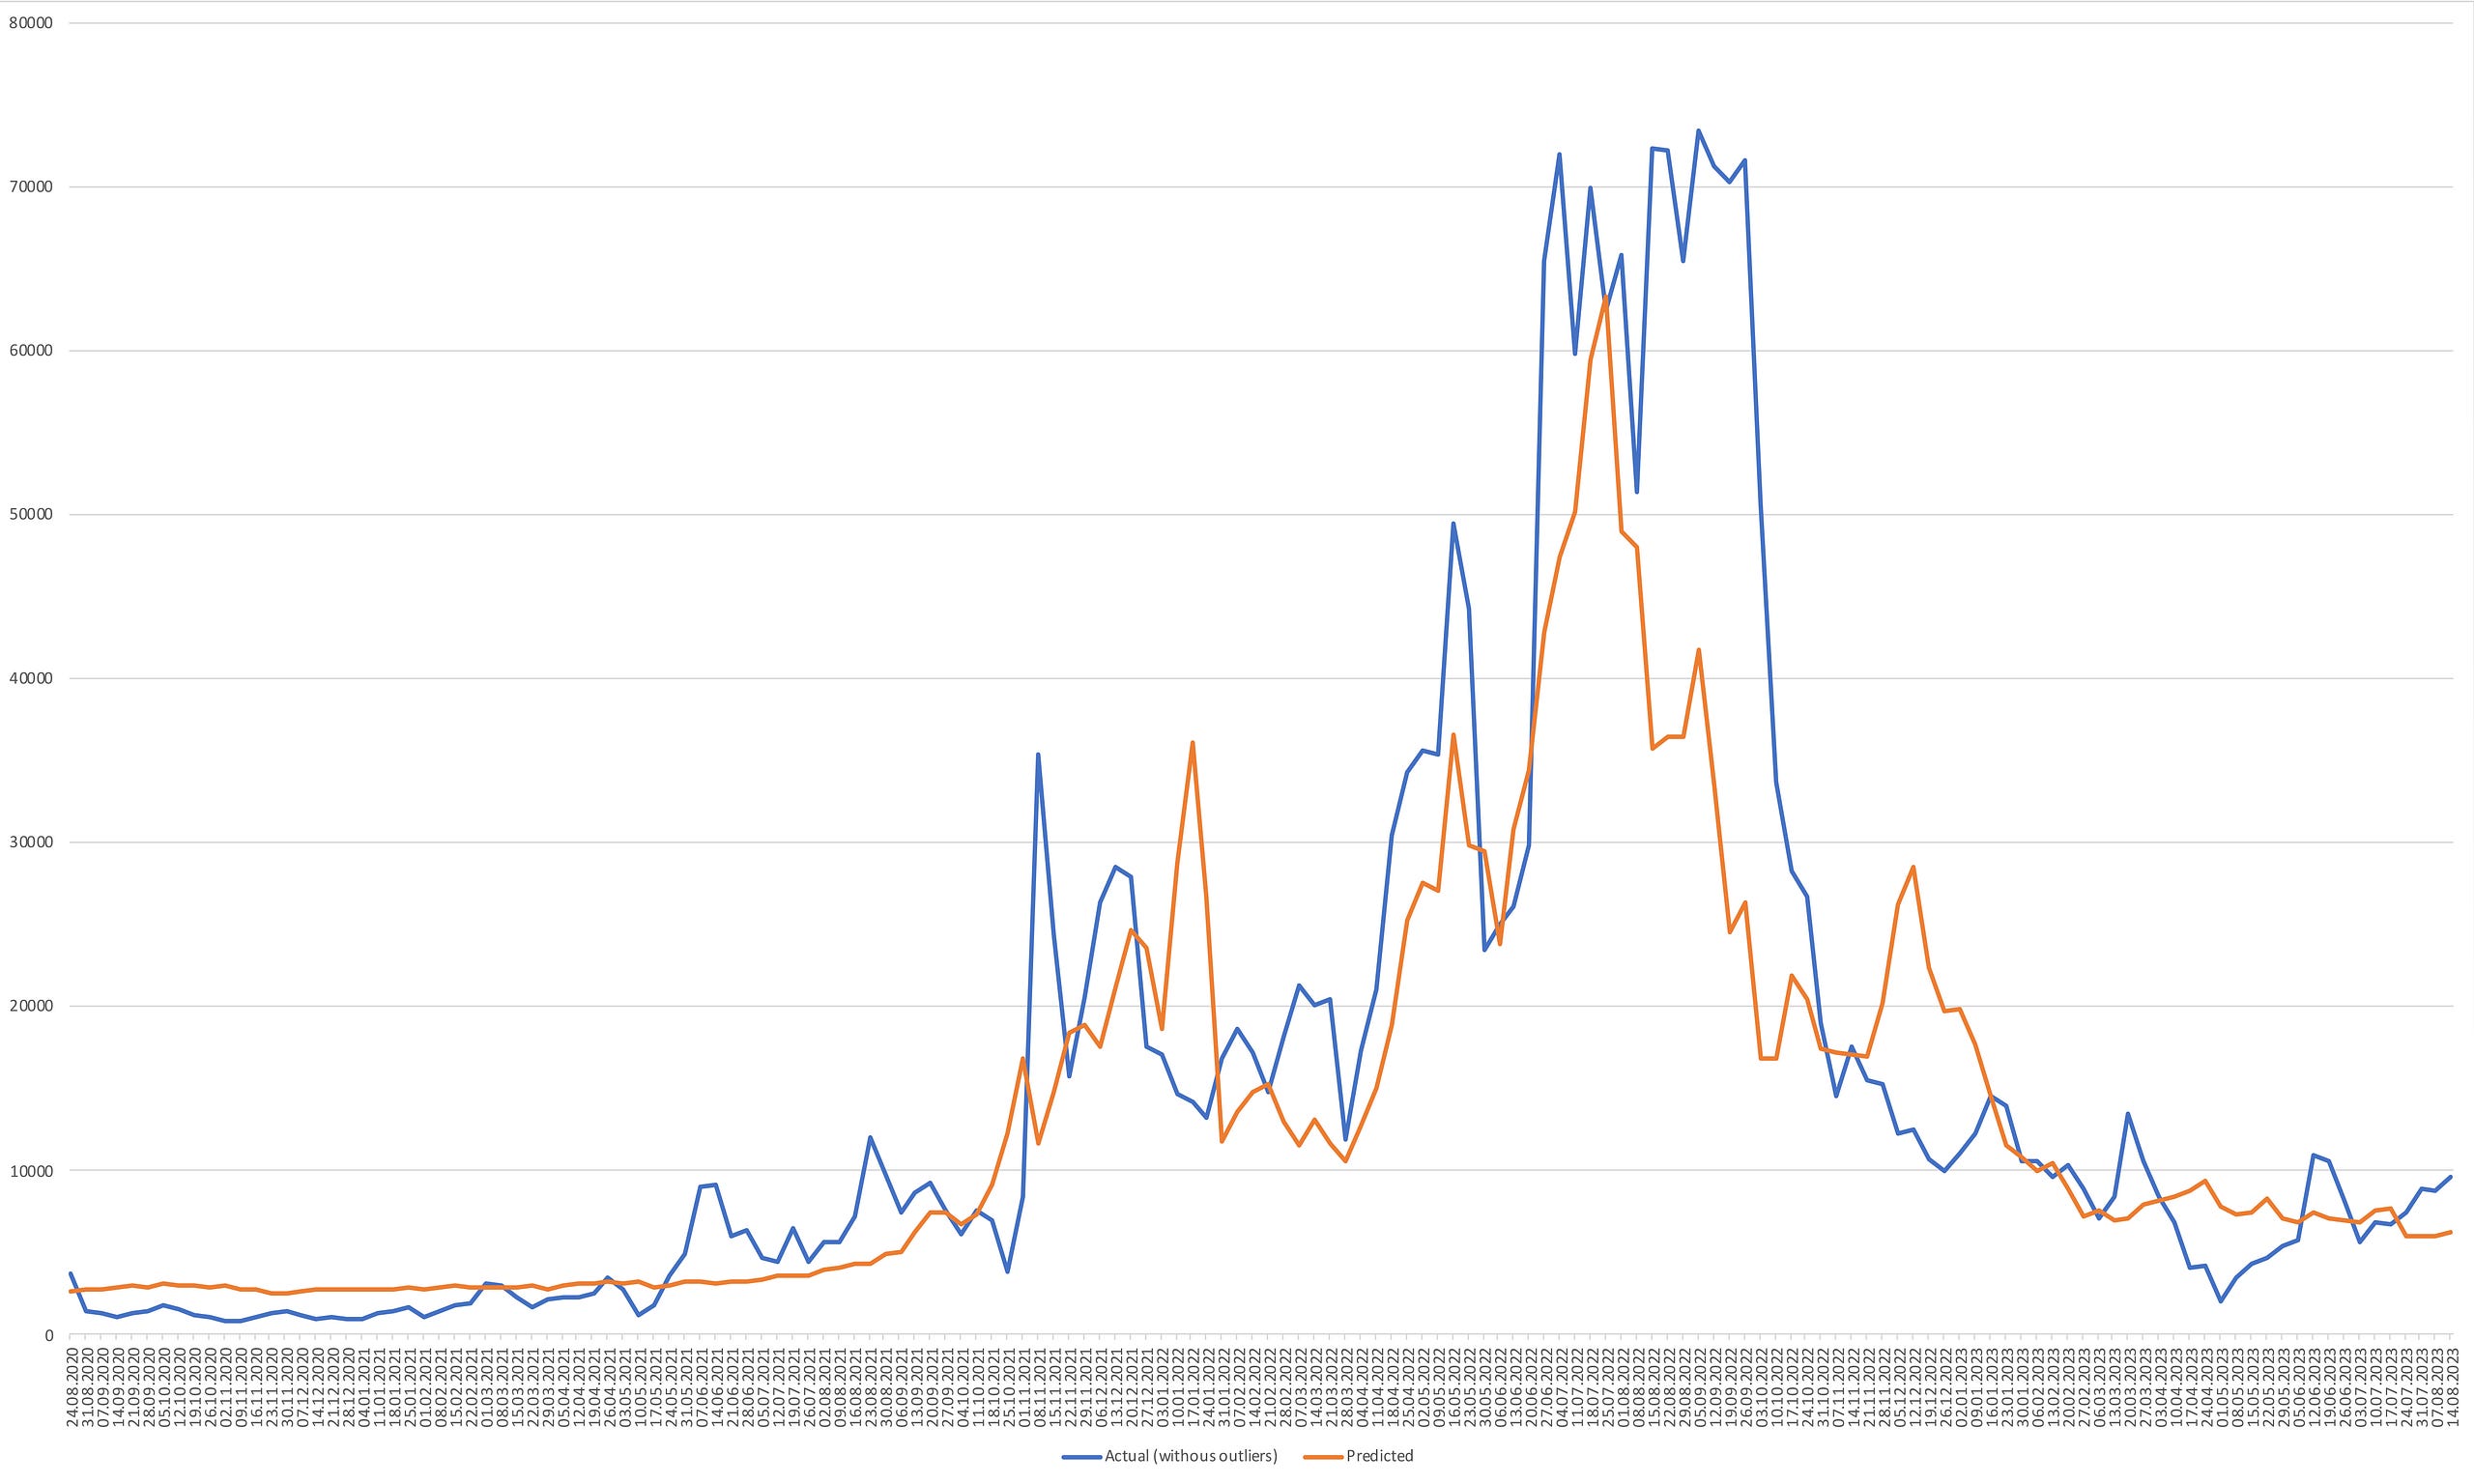
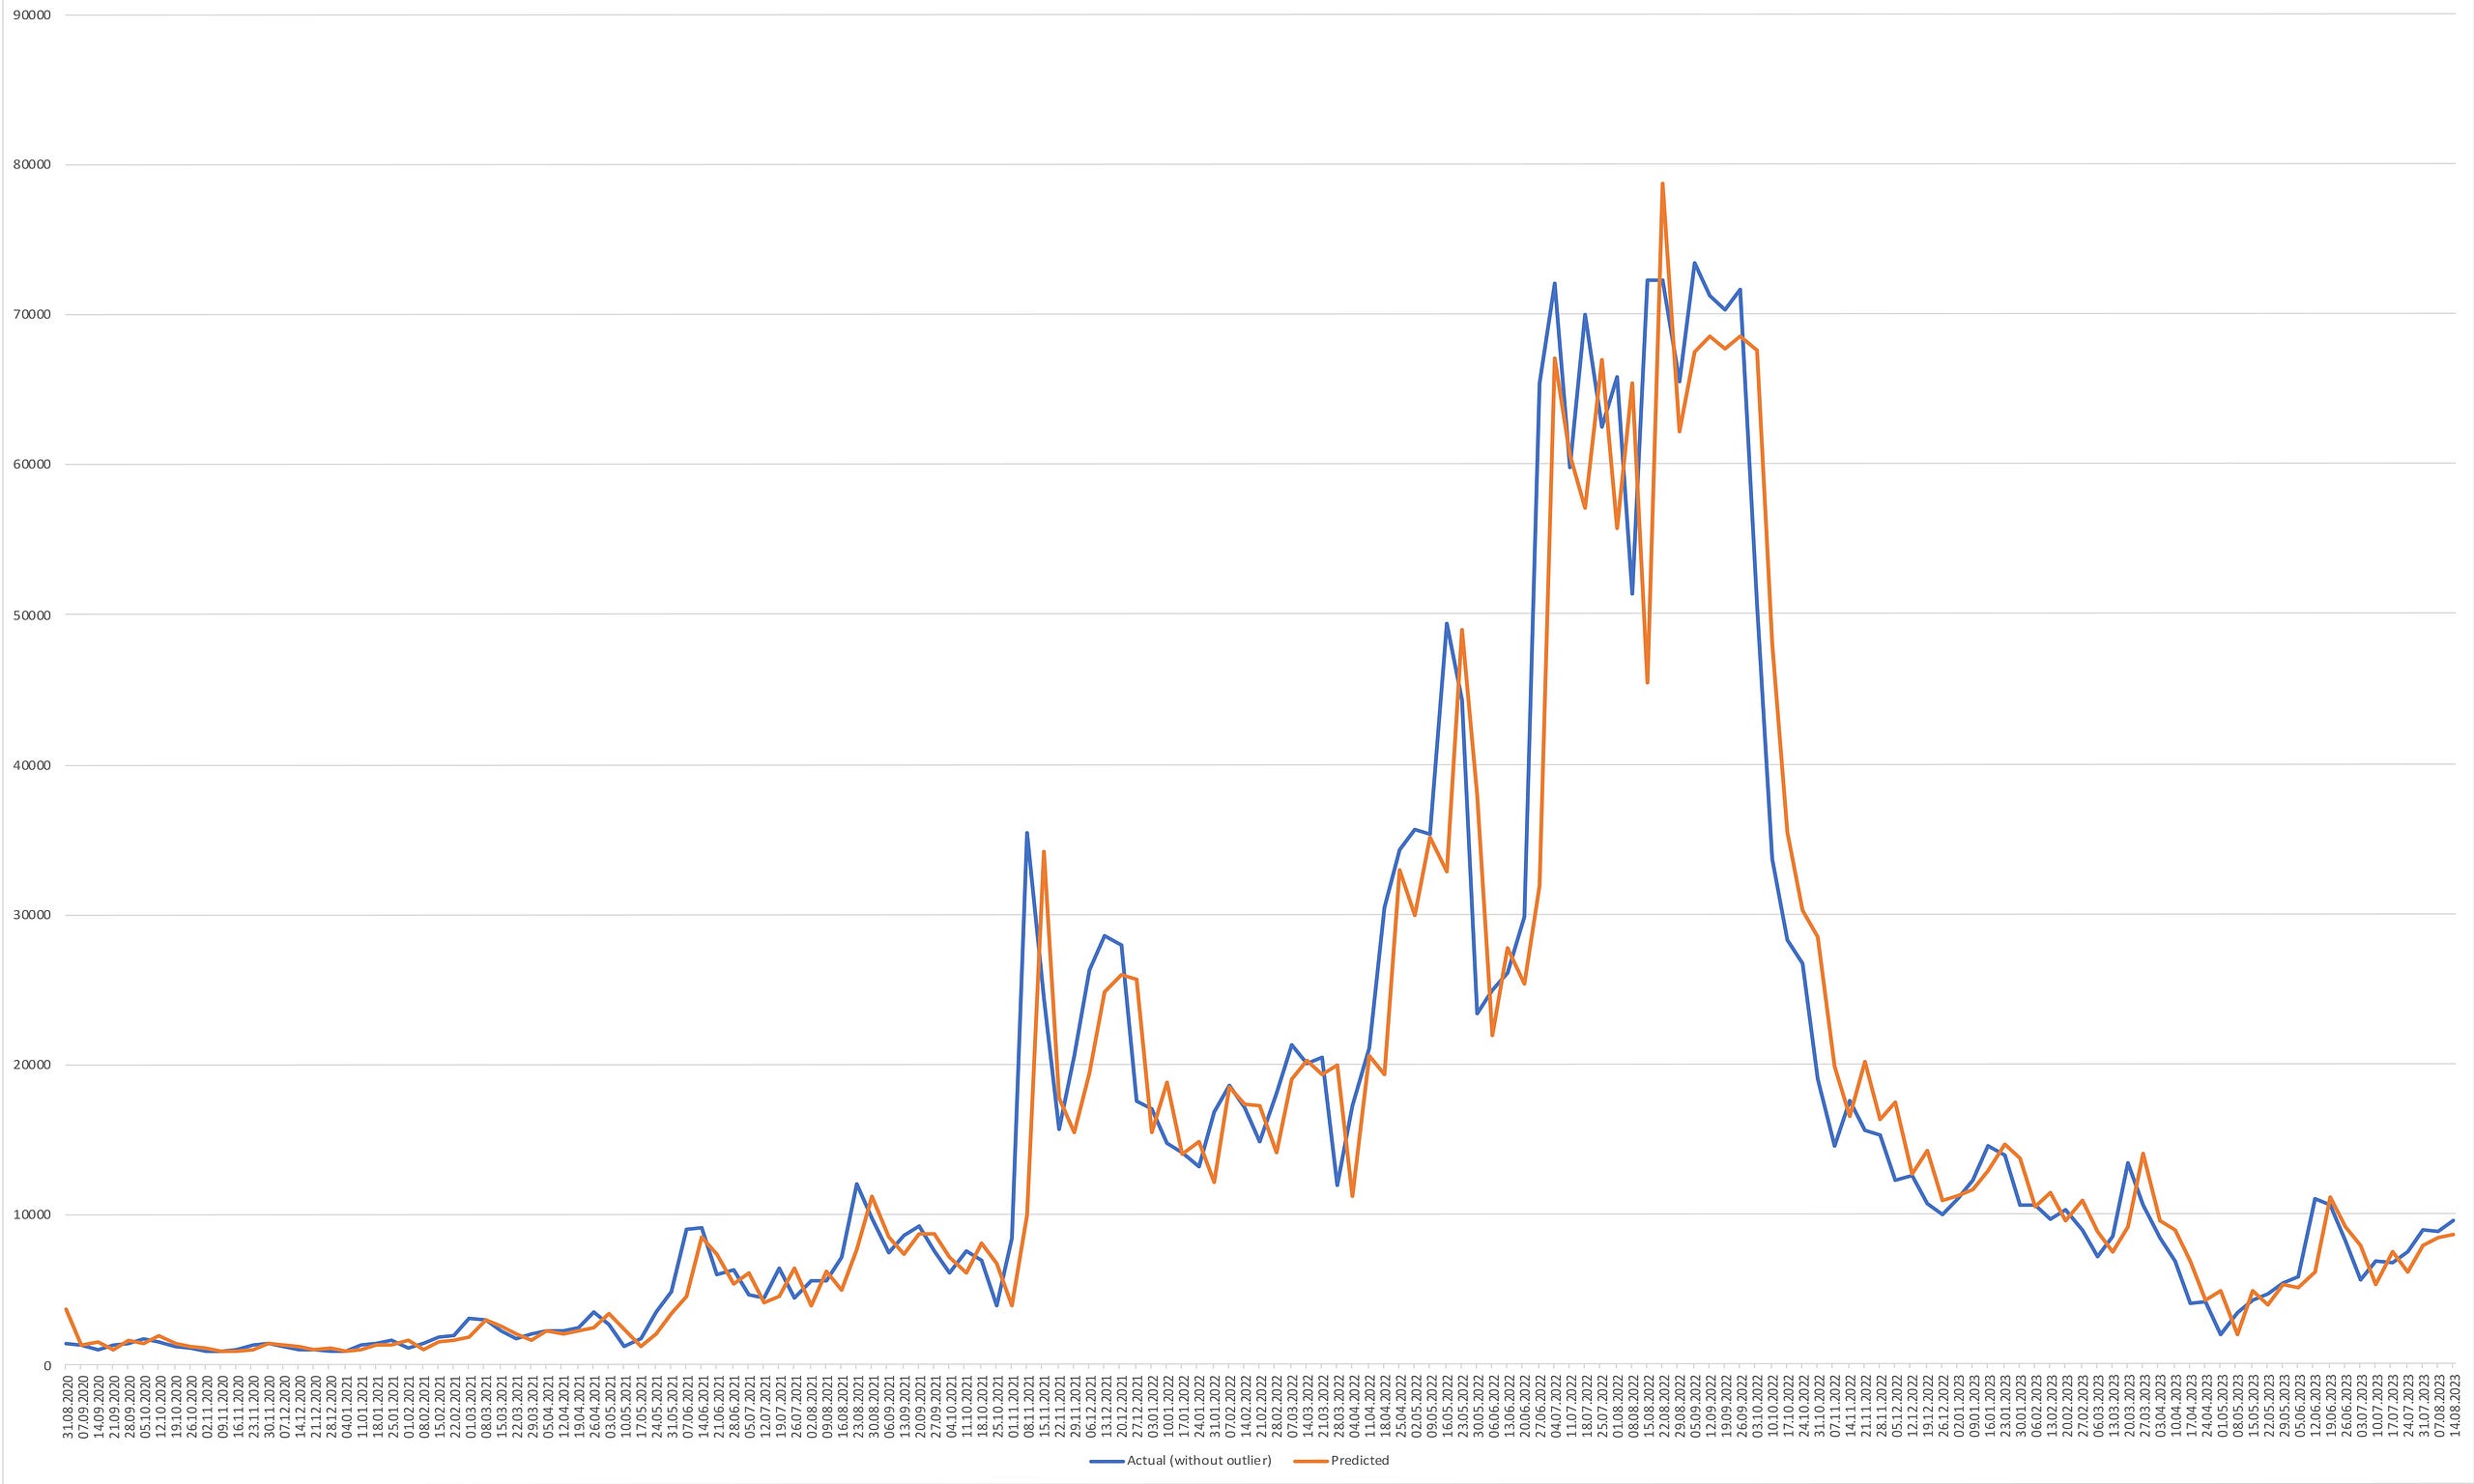
Final Model Construction: We build final models that solve or take into account existing problems. With autocorrelation of residuals, we have two options. This is either to build models that take it into account, or models that solve it. But the problem is that all models that would solve this problem are based on adding the factor of influence of the independent variable on itself. Thus, 4 models were built: 1 without taking into account the previous values, 3 – taking into account. The first model is a generalized least squares method with a covariance matrix compiled by the Cholesky decomposition of the matrix of autocorrelation values. The following models - taking into account autoregressive factors, are presented in different variations, but for example we will take ARIMAX - the same machine learning model that we used above, but with the addition of exogenous factors.
GLS Predictions
ARIMAX Predictions -
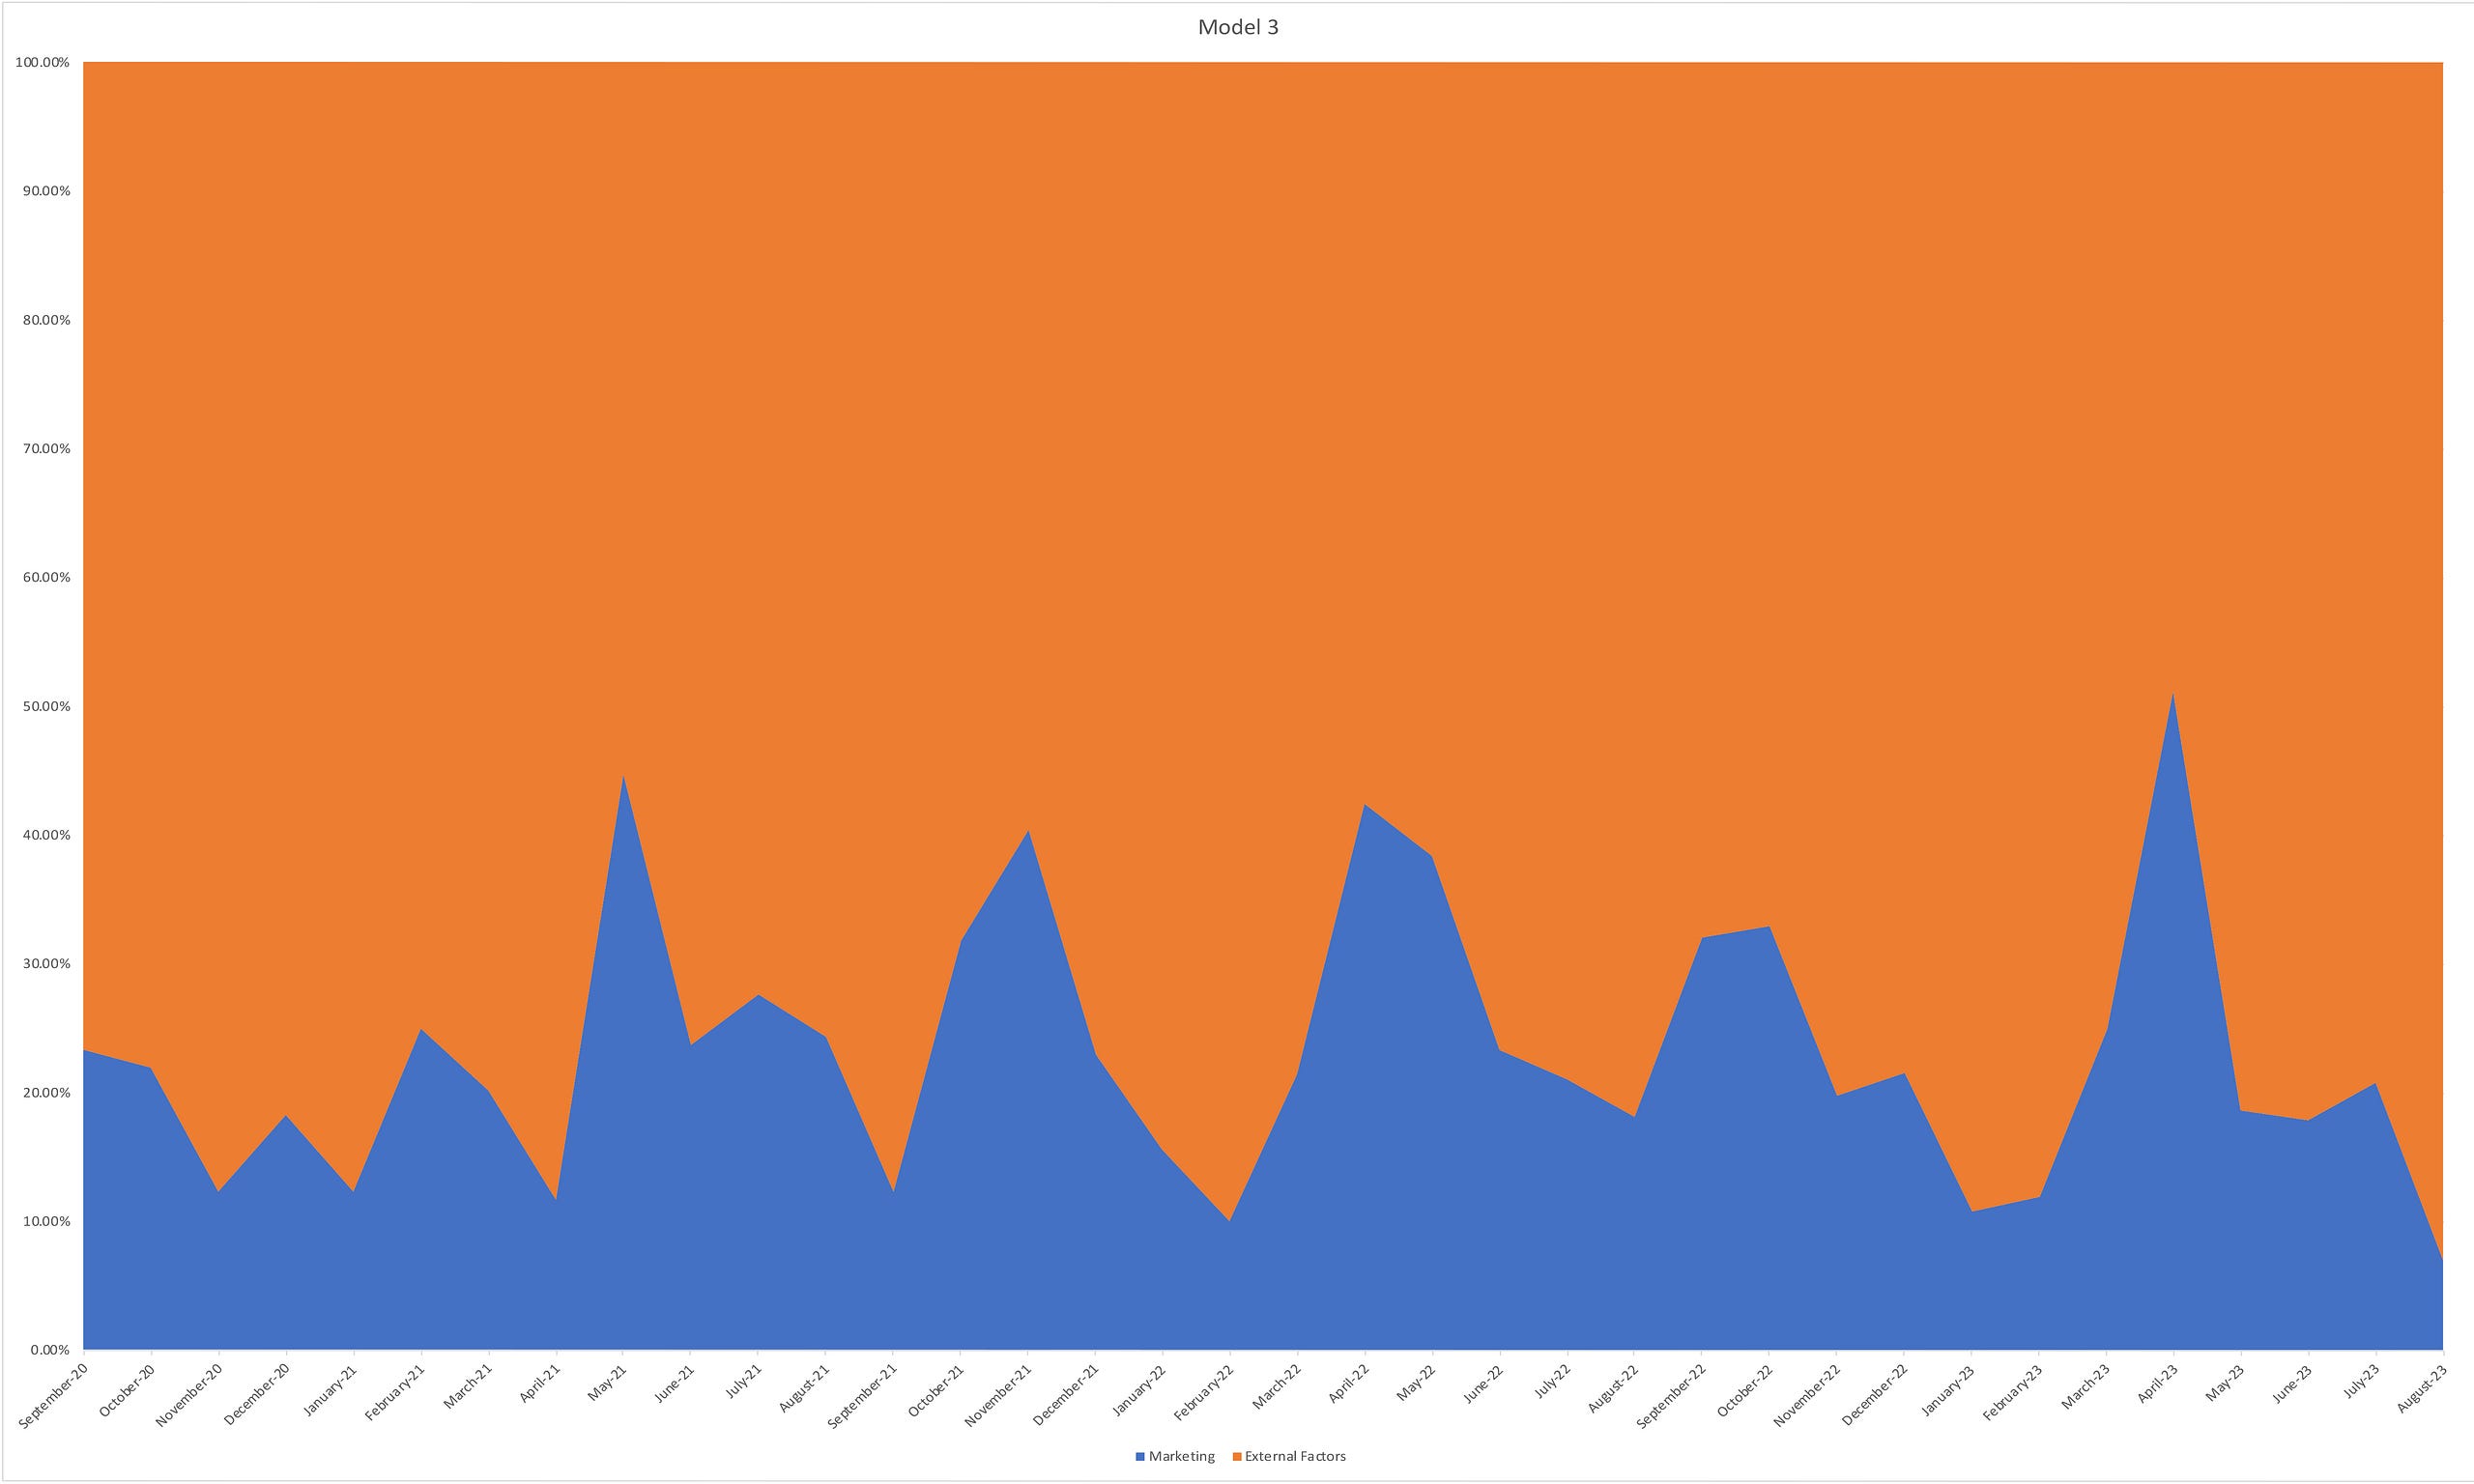
Error Analysis: Thus, we have the “exogenous factors – sales” and “exogenous and autoregressive factors – sales” models. Now we can take the absolute percentage error of the second model, but precisely when comparing it with the original data without imputation emissions, and assert that this is the share of the influence of marketing on sales. And taking the first model, its absolute percentage error minus the absolute percentage error of the second model we can consider the influence of autoregressive factors. And 100% minus the percentage error of the first model will be the influence of external general market factors. Thus, we can create a component diagram using the average values for all historical observations.
Marketing <=> Autoregressive + Exogenous Factors proportion (ARIMAX) -
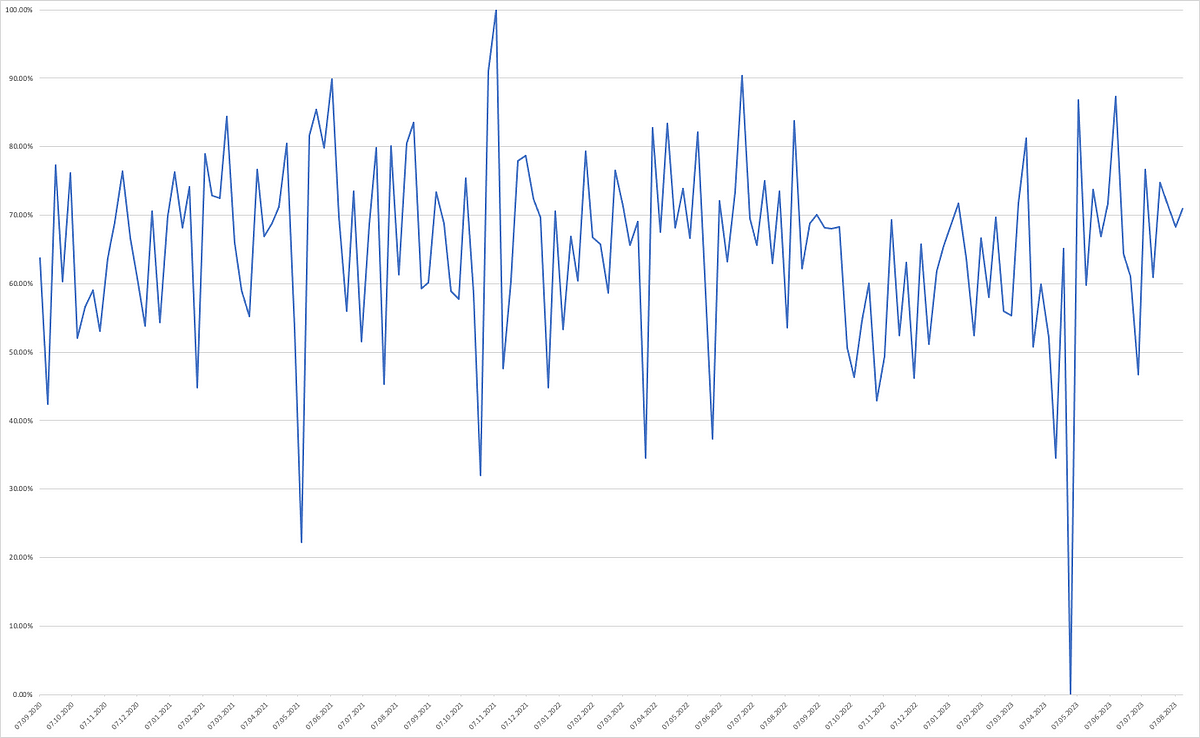
Marketing Effectiveness Evaluation: Now we can evaluate the effectiveness of marketing within this proportion by week. To do this, we use linear interpolation, where the starting point will be the moment of the maximum percentage overestimation of the predicted values by the second model. This will be 0% effectiveness of marketing influence, because in this case the mathematical expectation was maximally higher than the values observed as a result. And as the end of the countdown, that is, 100%, we will consider the moment when the model maximally underestimated the value of sales. Thus, we obtain such a graph of marketing effectiveness within its 23.5% average share in sales dynamics.
Weekly Marketing Performance (ARIMAX) -
Finally, we can get a historical graph that reflects how many sales individual groups of factors brought us.
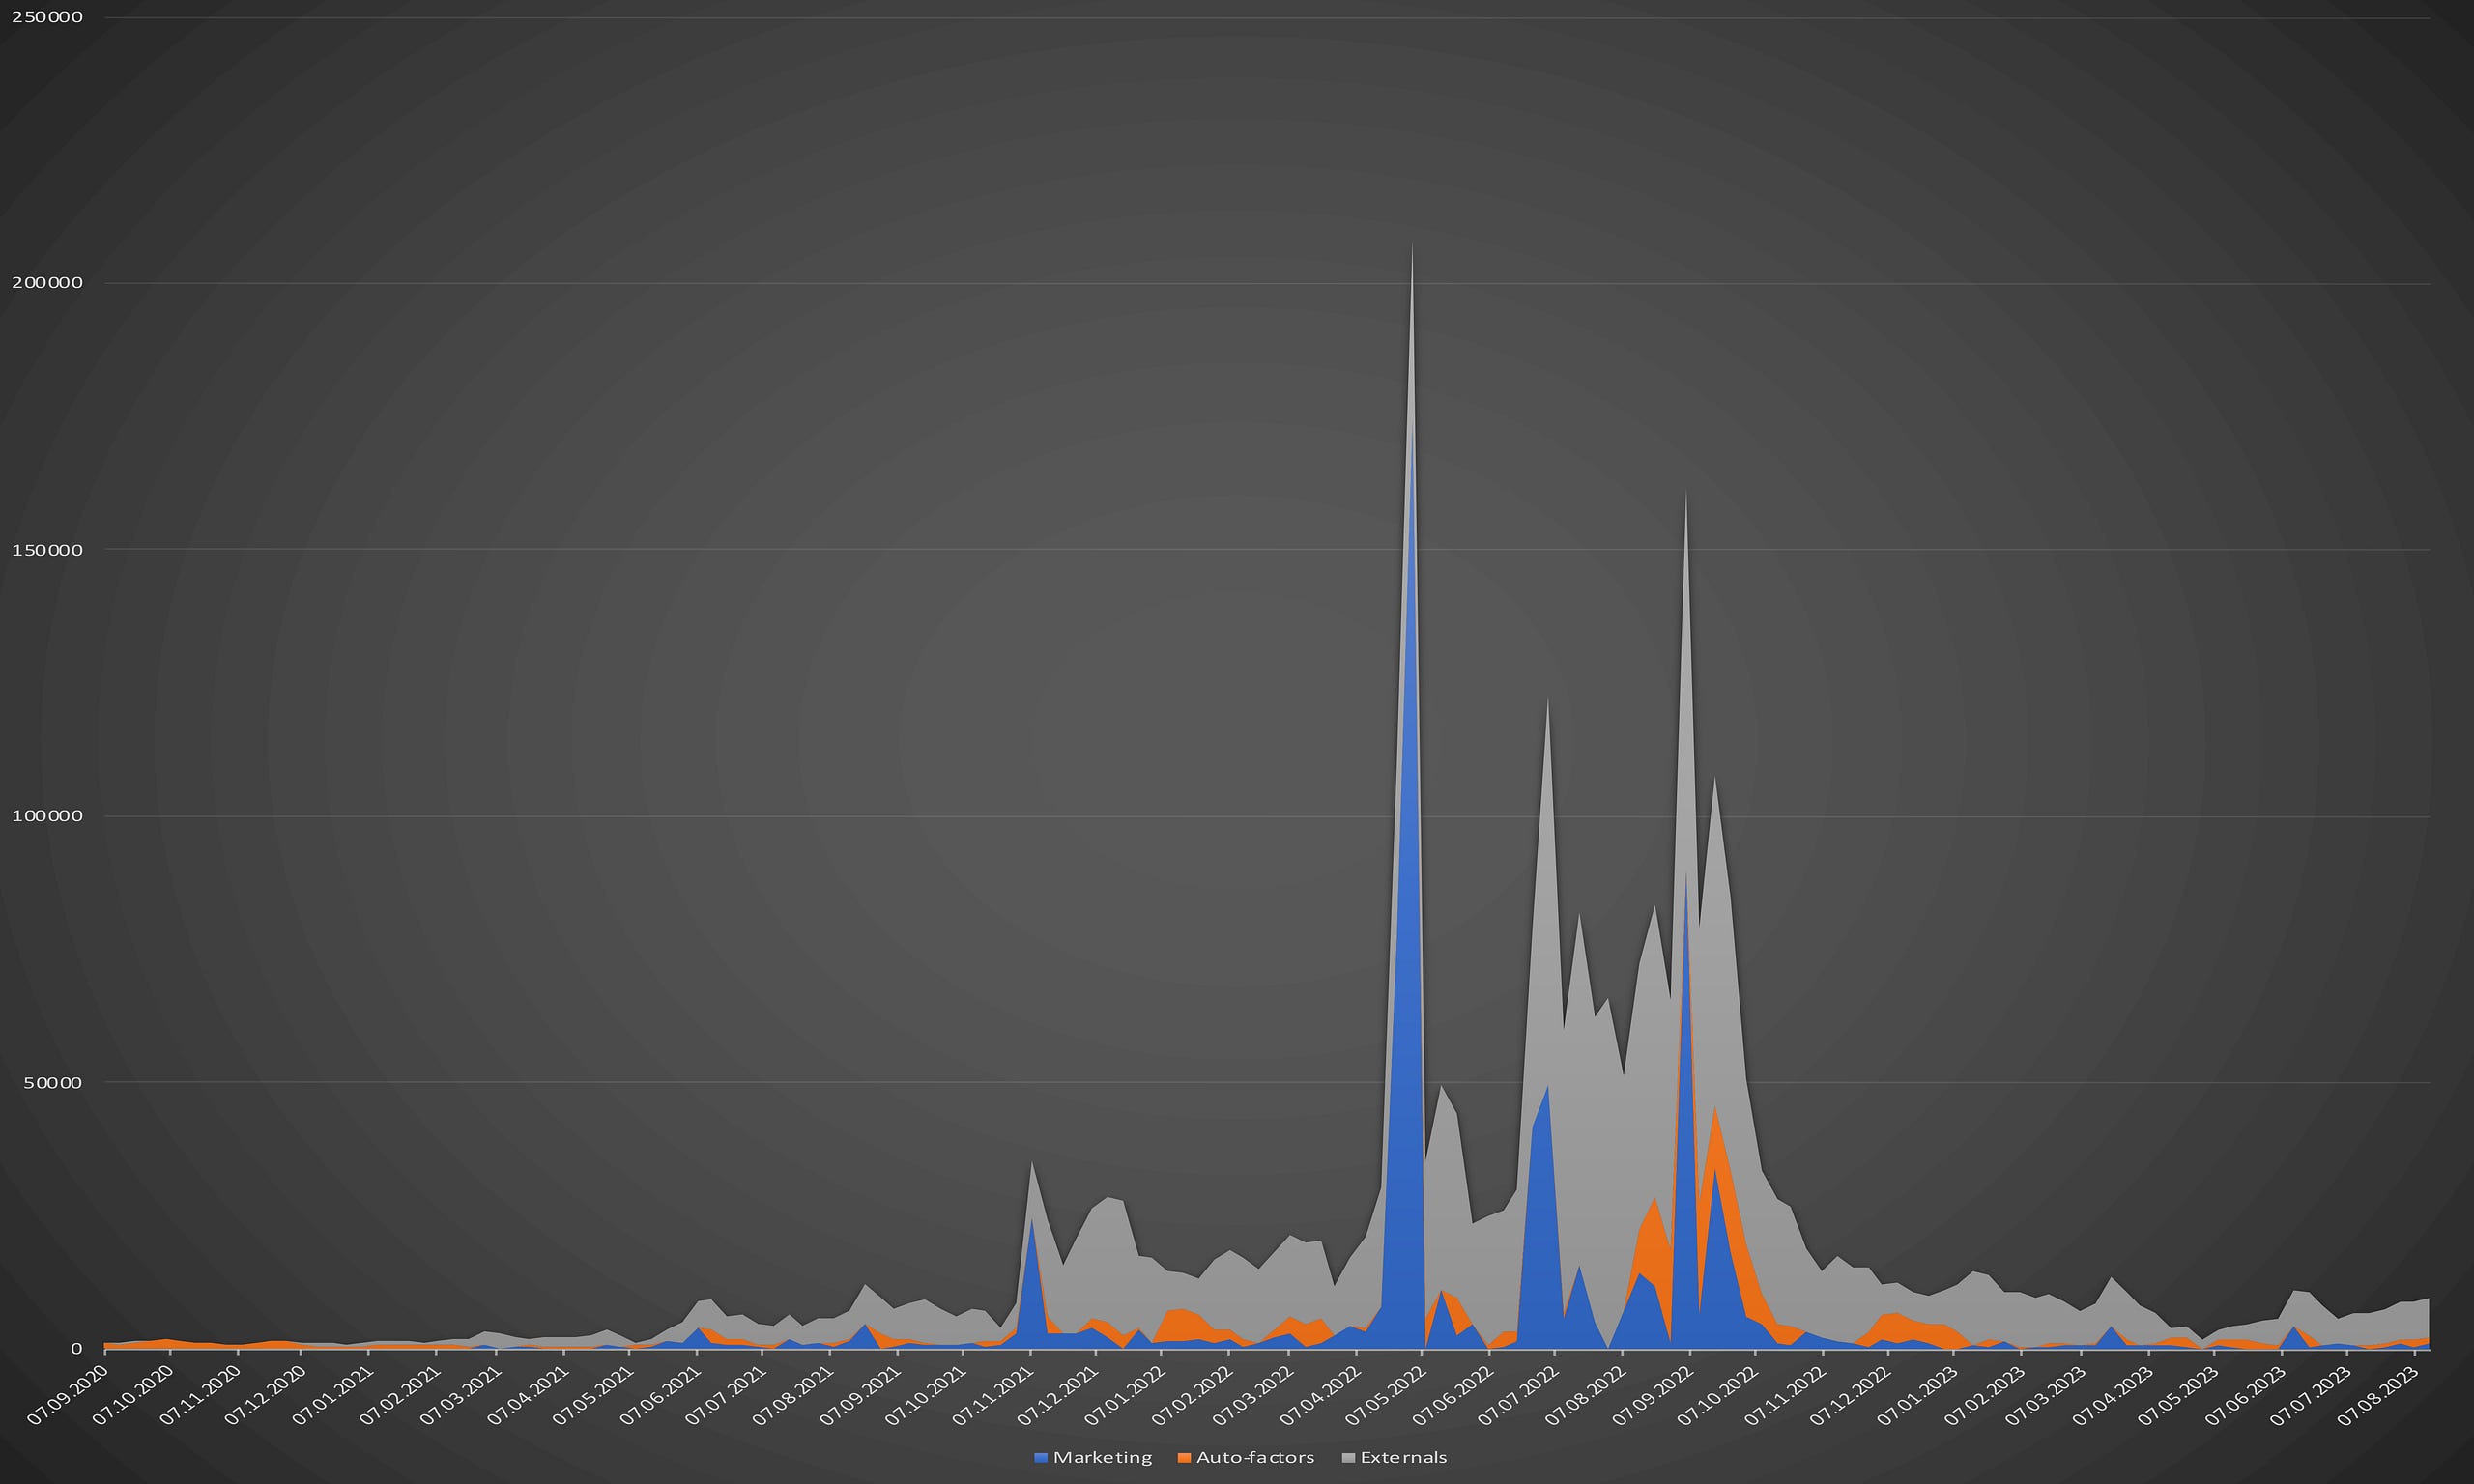
Based on the comprehensive analysis conducted, several key insights have been gleaned:
-
Temporal Shift in Dependency: There exists a temporal lag in the relationship between name sales and external factors. This is advantageous as it provides us with the opportunity to preemptively address associated challenges.
-
Function of Dependency: The dependence is exponential. From the point of view of the absolute number of sales, this can have a twofold interpretation: on the one hand, market growth gives us multiple growth, but even with a fall in market indicators, we are heading down at the first cosmic speed.
-
Dynamics of Dependency: The dynamics of sales are largely congruent with market trends, indicating that our sales performance is closely tied to market fluctuations.
-
Proportion of Factors: Perhaps the most disconcerting revelation is that our influence over sales is relatively limited, accounting for only approximately 23.2-23.5% of total sales. The remaining influence is exerted by external market factors and past performance metrics.
These findings underscore the critical importance of external market conditions in shaping our sales trajectory and highlight the limited scope of our internal control. This necessitates a strategic reevaluation to enhance our resilience against market volatilities and to capitalize on favorable market conditions.
What should an ideal picture look like?
There is no point in taking the proportions of classic business as a standard, since we are in a new and rather chaotic area. All we can say is that the public perception of the ENS product is dominated by a speculative image.
But is this really a problem?
Let’s imagine three hypothetical situations.
The market is in a bullish phase, everyone is interested in web3. After a certain lag (as we found out earlier), ENS sales go up sharply. We can really either relax or use marketing as a success multiplier and get more people in this bullish phase. And then fix sales at a consistently high level, if we turn the outliers into systematic levels of sales (autoregression factors will already play a role here).
The market is in a bearish phase, everyone is screaming that crypto is a scam. Here we can relax and wait for the next bullish phase. Well, or use marketing influence as a shock absorber so as not to end up in a situation where it is impossible to implement the entire development route map due to lack of funds.
The market is in stagnation, no one knows where the development will go next, as is happening now. Here we can relax and wait for the outcome of the situation together with everyone. Or we can take this as the most powerful opportunity to finally disengage ourselves from speculative perception. If the whole market is hibernating and we are increasing our influence, then our product is not just a money-making tool or a beautiful trinket for people who have nowhere to spend their money, but a really important part of the web3 infrastructure.
The marketing effectiveness rate averages 60–65% and very rarely falls below 50%. This is certainly good, but it should be remembered that these are only values that lie within the 23.5% range within which we influence sales through marketing. In order to positively differentiate ourselves from the market and autocorrelation factors, we must systematically go beyond 100% of this range.
But how can you get beyond 100% above the range if we take into account the influence of “yesterday’s success”?
From the judgments about the breaking of the trend, I believe that autoregression factors do not obey the will of the actors. Our task is to stabilize sales at a relatively high level by turning statistical outliers into a system. In this case, we can say that the influence of autocorrelation factors is our merit, and not a derivative of industry phenomena. That is, roughly speaking, we need to positively violate the expectation of the models until we manage to gain a foothold on the values that are currently extreme.
Extrapolation of Regression Data to the Conversion Funnel
Using the algorithm described above, I analyzed not only sales, but also:
Search queries, as this metric reflects user interest at the awareness and interest stages of the conversion funnel.
Unique visits as they reflect stages of consideration, evaluation and intent.
You can see the analysis of these variables in the full version of the study.
This is what extrapolation of the data received from the algorithm to the conversion funnel looks like in a logical diagram:
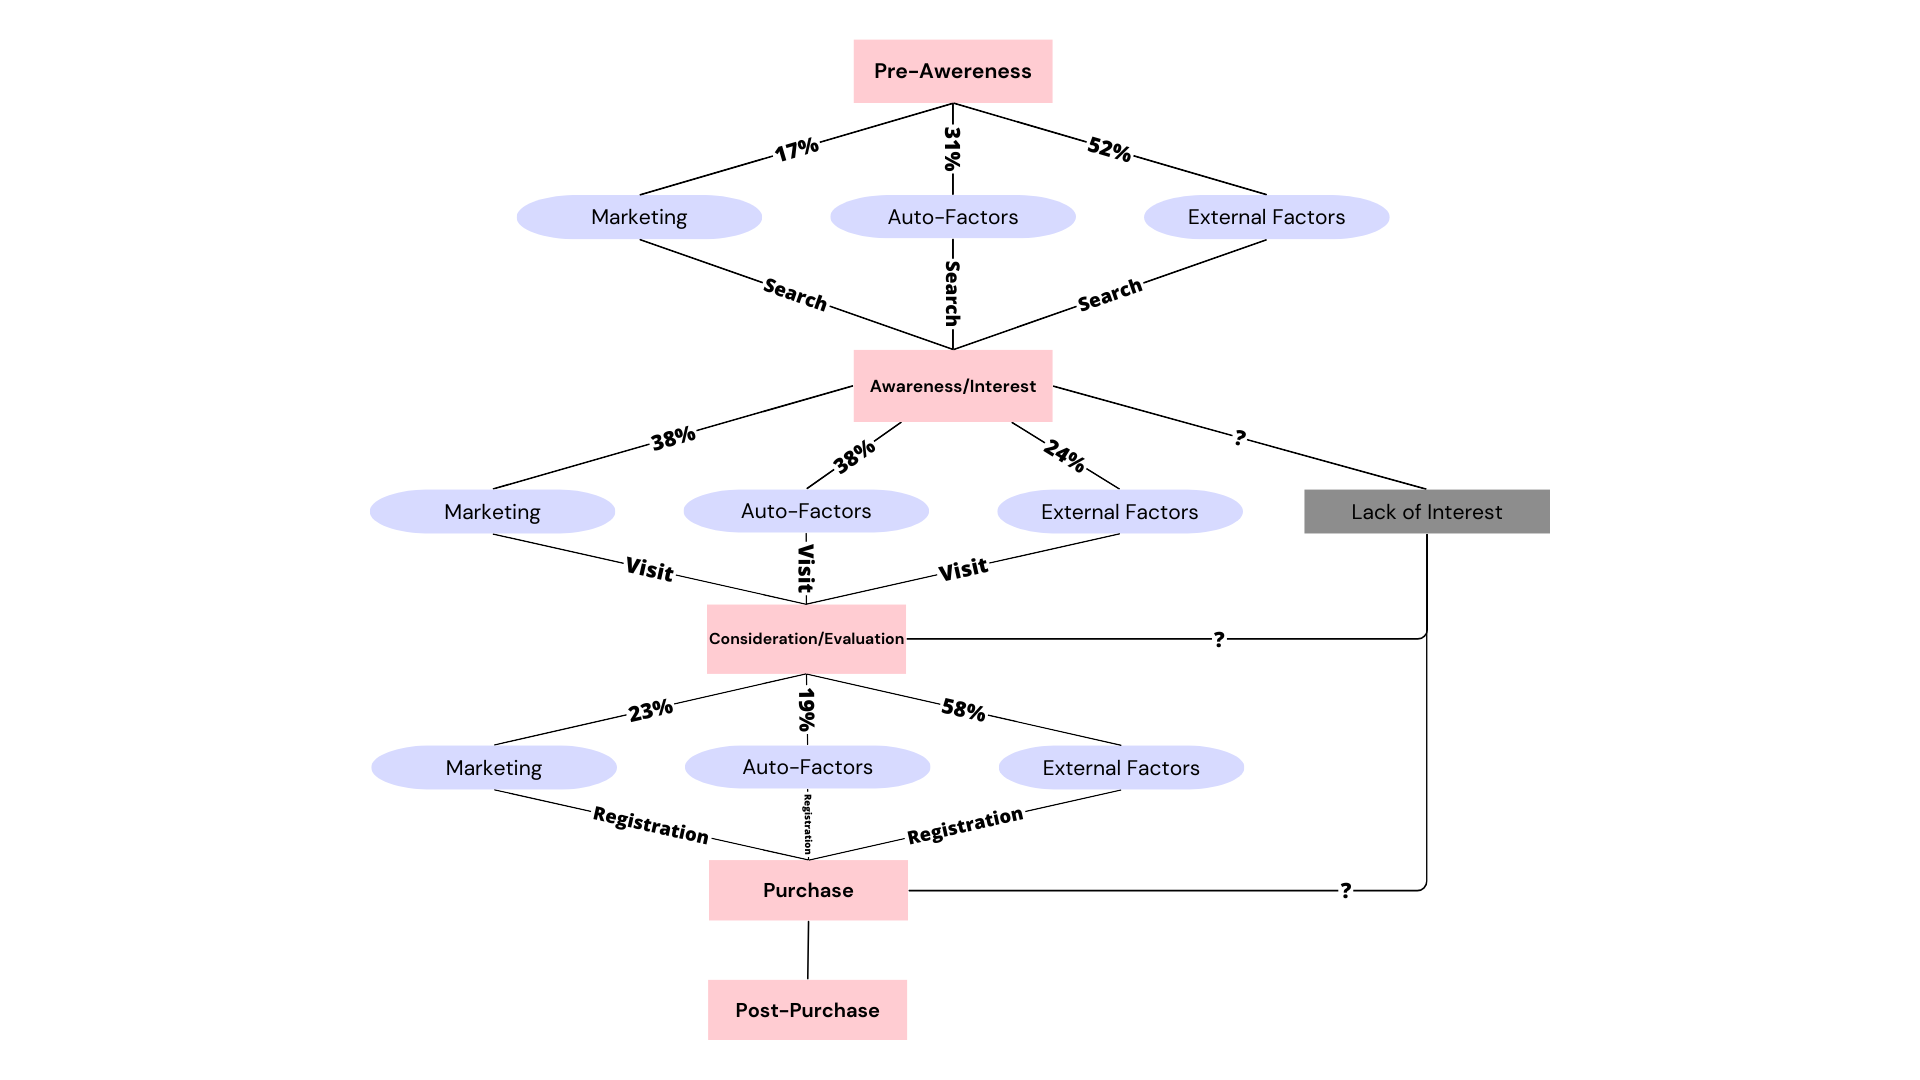
Based on the diagrammatic representation, the following conclusions can be elucidated across different stages of the customer journey:
Pre-Awareness to Awareness
- Minimal Marketing Influence: The impact of marketing at this stage is relatively insignificant, which is consistent with ENS’s marketing strategy that predominantly targets users with a foundational understanding of the product.
- Dominance of Auto-Factors: A substantial proportion of the influence at this stage is attributed to sustainable development factors or auto-factors, likely driven by network effects.
- High External Influence: A considerable percentage of the influence emanates from external factors, potentially attributable to speculative interest in the ENS token.
Awareness to Consideration, Evaluation, and Intent
- Significant Marketing Impact: Marketing exerts a considerable influence at this stage, corroborated by the efficacy of ENS’s marketing campaigns, such as targeted search engine advertising.
- Sustained Influence of Auto-Factors: The proportion of sustainable development factors remains elevated, likely propelled by word-of-mouth and network effects.
- Diminished External Influence: The influence of external factors is at a nadir, suggesting that well-informed users are less susceptible to speculative forces.
Consideration, Evaluation, and Intent to Purchase
- Reduced Marketing Influence: The impact of marketing wanes at this stage, possibly due to factors such as suboptimal website design and SEO, which impede marketability. This suggests that ENS’s marketing strategies may not sufficiently engage users at the evaluation stage to catalyze conversions.
- Persistent Auto-Factor Influence: The influence of sustainable development factors remains robust, likely underpinned by brand loyalty, word-of-mouth, and network effects.
- Resurgence of External Factors: The influence of external factors rebounds, indicating that users, when evaluating the product, may be more inclined towards speculative rather than practical considerations, viewing the names as a revenue-generating asset.
From this we can draw practically significant conclusions that will help us identify the problems of the approach to marketing. This is exactly what the third chapter of the study is devoted to.
Final Part: The Impact of Marketing on ENS Success
The subject matter under scrutiny in this chapter is considerably more intricate and expansive than that of its antecedent chapters. The primary objective herein is to undertake a comprehensive analysis of an organization’s overarching marketing strategy or discrete campaigns. The realization of this aim necessitates the utilization of an array of internal metrics and specialized analytical instruments. Therefore, the study of the object in this episode of research is only a demonstration that the problems do not lie on the surface.
To substantiate this point, I conducted a cursory analysis of the Website-to-Purchase conversion rate, with a specific emphasis on the dimension of user experience. The global user interface underwent modifications on two distinct occasions, thereby enabling the segmentation of historical data into three discrete phases:
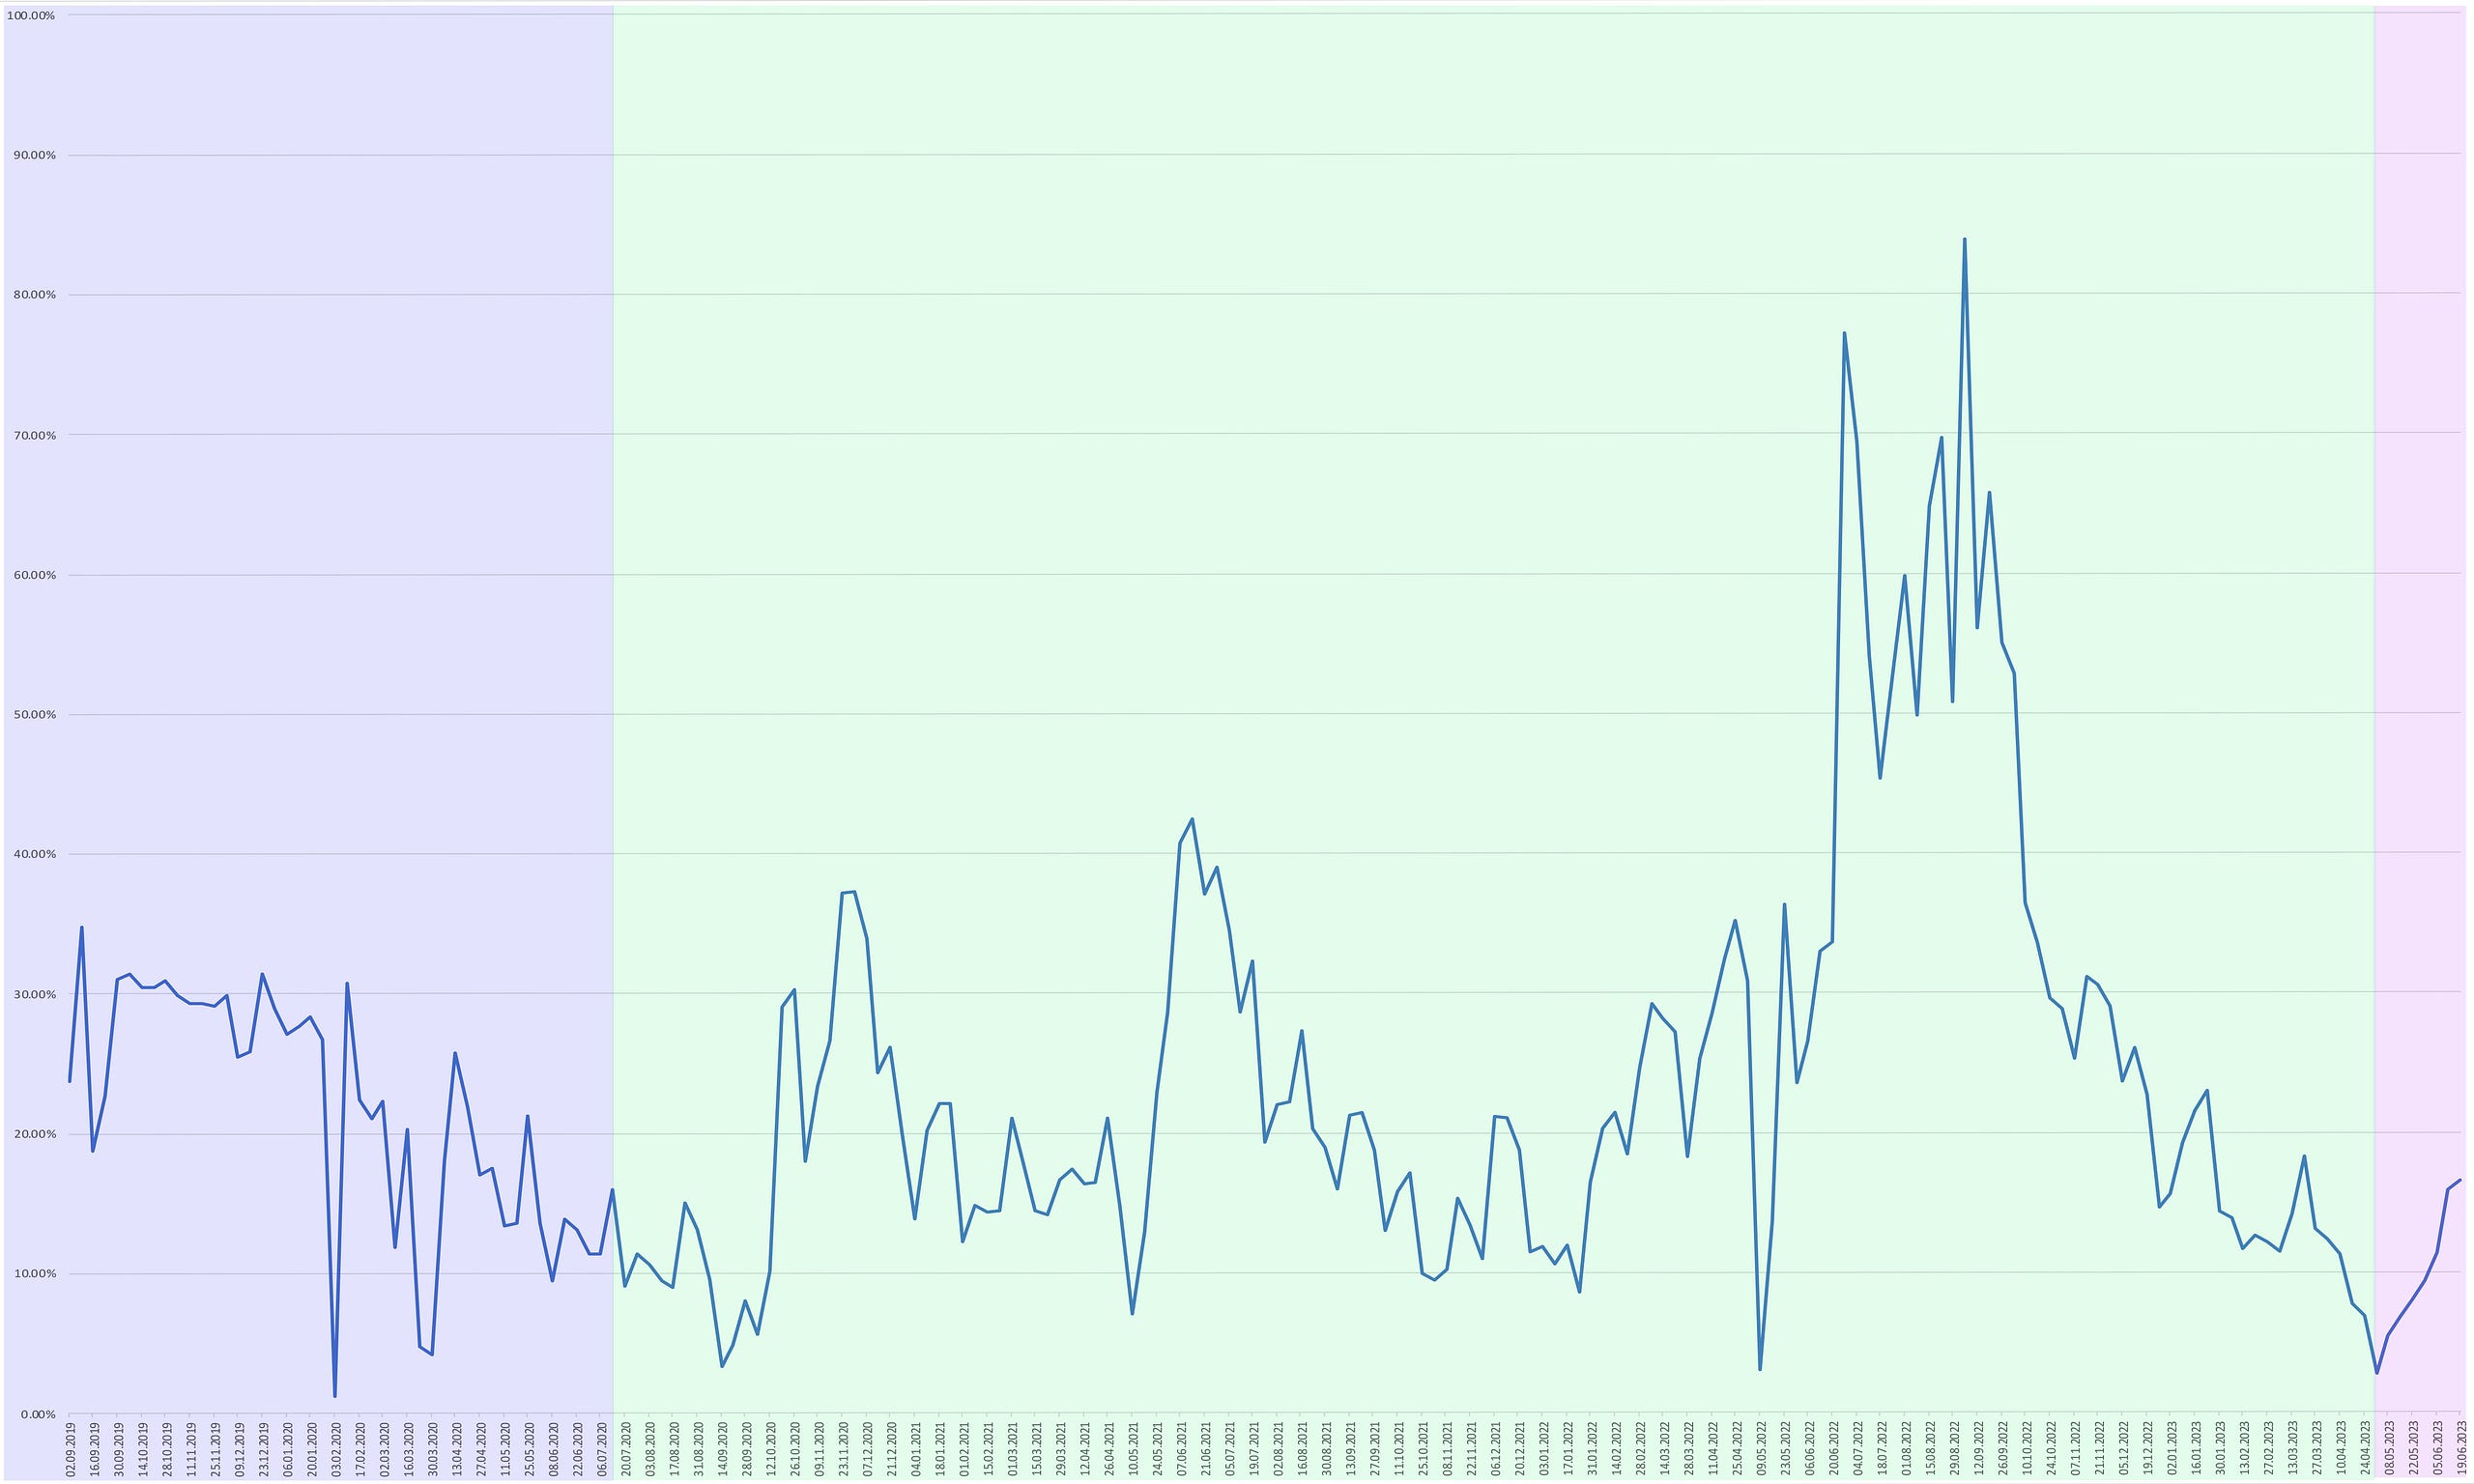
The first stage is "the manager” era, the second is "the application” era, the third is "the v3 application” era.
From the segmented analysis, I drew the following key conclusions:
-
In regard to the prevailing circumstances, the UX enhancement, strategically synchronized with the launch of the new NameWrapper, has elicited a markedly positive impact on conversion metrics, thereby ameliorating the extant crisis. Contrary to the transient downturn experienced during the prior comprehensive overhaul of the user interface, the current update manifests no such decline and can be deemed a good exemplar of ENS’s marketing efficacy.
-
It is pertinent to note that the oscillations in conversion rates observed during the secondary period are not attributable to this facet of the Customer Journey, as no significant alterations were implemented during this interval. Furthermore, it is noteworthy that peaks in conversion rates are generally congruent with zeniths in sales. Specifically, the moment of greatest conversion was created by a situation in which users intended to buy a name even before visiting the site, and in most cases they made a purchase. Consequently, the nature of the average website visit has changed from intent to consideration/evaluation as conversion rates began to trend downwards.
In this regard, I make the following
Proposals
3.2 Segmented Marketing ROI Analysis
Essence:
The initial episode of the investigation elucidated the efficacy of marketing strategies through indirect indicators, specifically via an inverse relationship with external variables. To attain a comprehensive understanding, however, it is imperative to assess the return on marketing investments. The outcomes of this subsequent analysis will provide critical insights into whether additional financial resources should be allocated to promotional activities, or if a reevaluation of the existing advertising paradigm is warranted.
Required Resources:
Data segmented on either a weekly or monthly basis, delineated by specific expenditure categories, is essential for a nuanced analysis. For instance, for the month of January 2022: expenditures on contextual advertising amounted to $3,000 USD; investment in YouTube integration was $1,000 USD; and allocation for Twitter integration stood at $500 USD, among other line items. This granular financial breakdown will facilitate a more targeted evaluation of the efficacy of each marketing channel.
Algorithm:
In general, the delineation of dependencies will be ascertained through the refinement of regression models and the application of machine learning techniques. However, the objective diverges from that of the current study. Our primary concern is not necessarily the performance metrics in relation to overarching market factors, but rather to quantify the impact that each facet of our marketing endeavors exerts on sales revenue.
- Formulation of a multifaceted model to identify distinct segments, temporal lags, underlying issues, functional dependencies, and ultimately, the computation of cost-effectiveness;
- Development of paired models to ascertain the significance of the multiplicative effects of each individual variable.
3.3 Qualitative Analysis of Marketing Aspects
Essence:
With insights into the cost-effectiveness of our marketing efforts at distinct time intervals, we can assess the success or failure of individual campaigns. This data equips us to systematically manage our marketing budget, enabling us to identify which particular segments warrant investment and which require immediate optimization.
Required Resources:
Settings parameters for contextual advertising services;
Terms of reference for specific marketing campaigns;
The implementation of these campaigns (description of what was done), although I can do this manually, simply by knowing which posts belonged to which campaign and determining this by the time that the campaign lasted.
Algorithm:
- In light of the findings from Section 3.2, pinpoint the areas where marketing expenditures failed to yield effective results through regression analysis.
- Conduct a comprehensive review of each campaign that was notably effective as well as those that were markedly ineffective, detailing their specific attributes.
- Formulate actionable recommendations outlining which strategies should be pursued and which should be avoided for future campaigns.
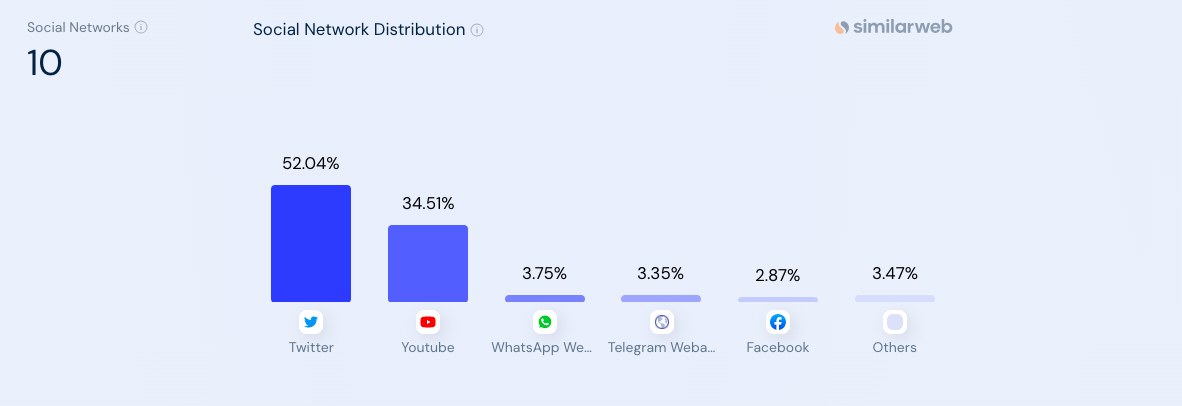
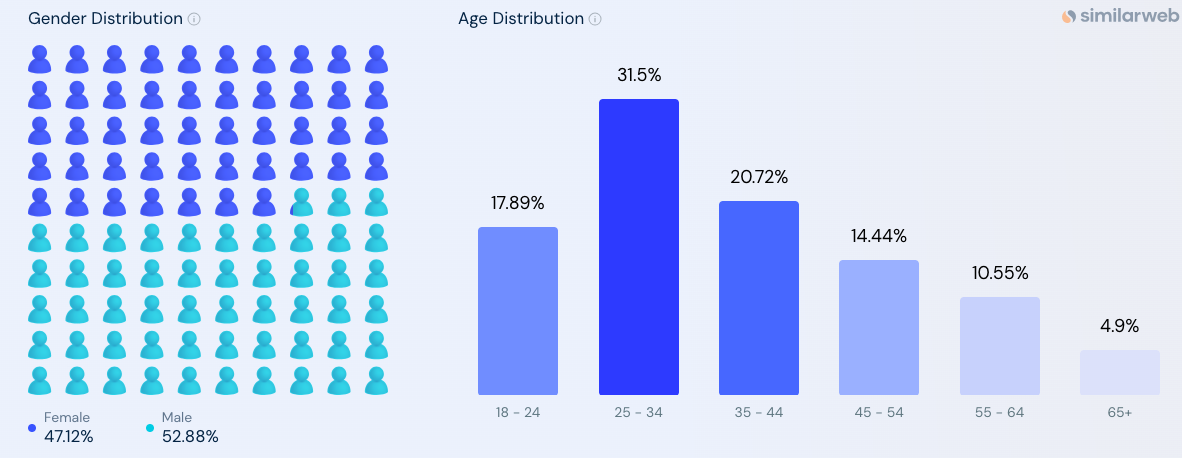
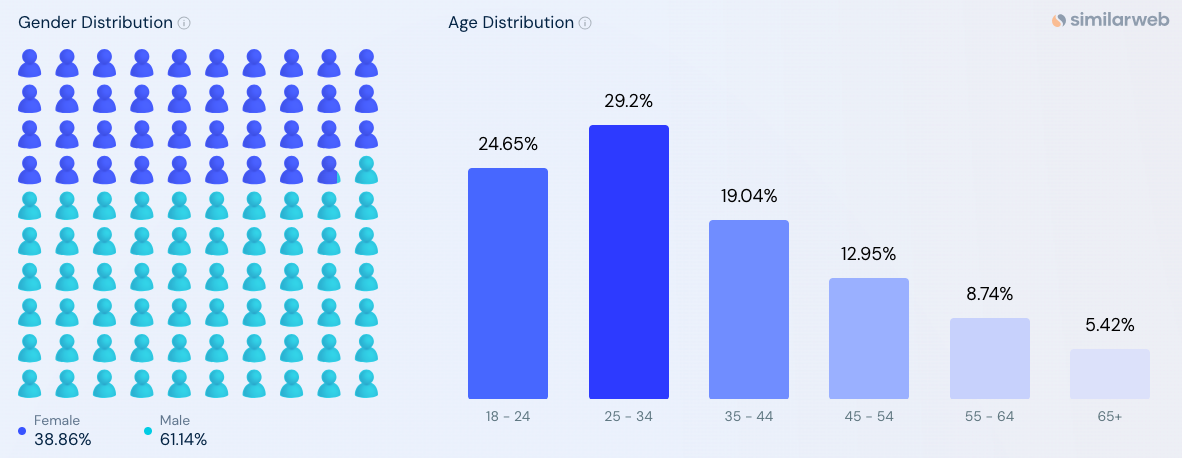
3.4 Target audience analysis
Essence:
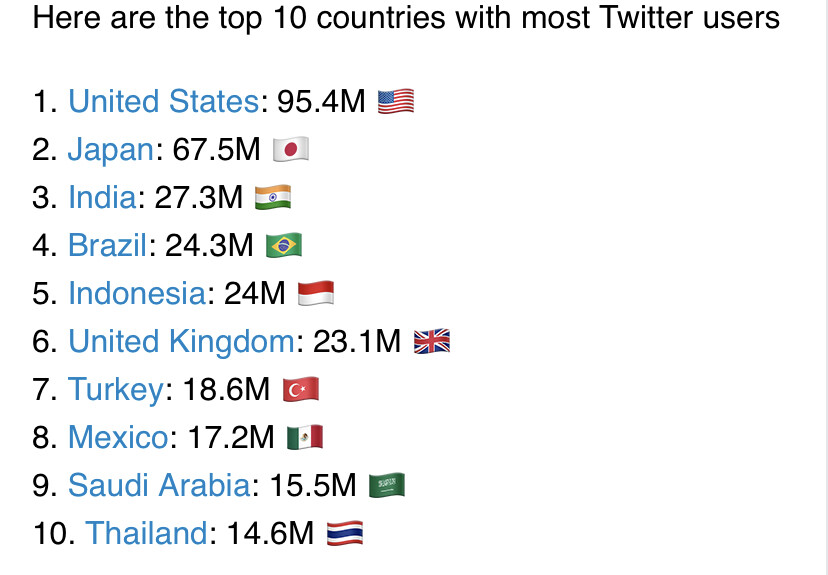
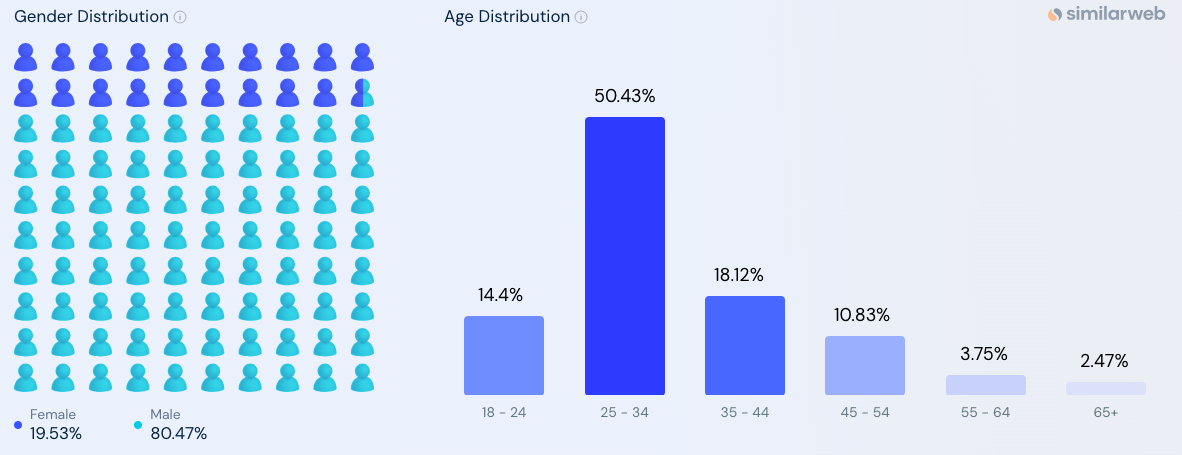
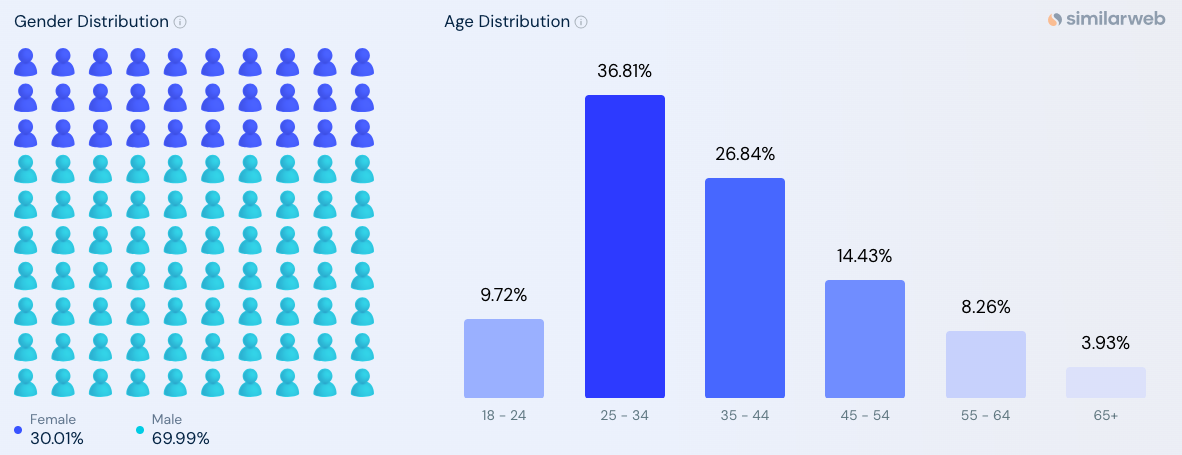
Demand for the ENS product, as unusual as it may seem due to the digital nature of the product, is limited. No matter how hard we try, we cannot go beyond the notional total number of cryptocurrency users at the moment. However, we can understand how the number of our consumers is currently classified. But let’s say that our average buyer is now an American 18–25 years old. This means that in some comparisons with other categories of persons, we have approached the “ceiling” with this category. This just means that we need to try to expand into other categories.
Required Resources:
Professional tools for analyzing website traffic, with segmentation by country, age, gender.
Algorithm:
- Examination of the predominant categories constituting our target demographic;
- Ascertainment of underrepresented segments that, given the product’s intrinsic utility, could potentially exhibit interest;
- Implementation of experimental protocols and pilot studies geared towards the engagement of novel consumer groups.
All of the above can be supported by audience surveys, which require the consent of the community and an official email or social media account.
And a bunch of other things, from examination demand in the secondary market to analyzing reputational capital.
Post-script: I admit that I may not have fully summarized the content of the entire study, so I recommend following the link and reading the full version.
I thank @matoken.eth for providing some metrics.
I will be sincerely grateful to you for criticism and pointing out logical errors, if any.
Let’s make the ENS product more marketable together!