This thread tracks ENS protocol fundamentals using five indicators. The financial indicators use Last Twelve Months (LTM) data to smooth short-term volatility. The objective is to monitor:
- Operating performance
- Fiscal discipline
- Valuation relative to revenue
- Treasury sustainability
- Governance decentralization
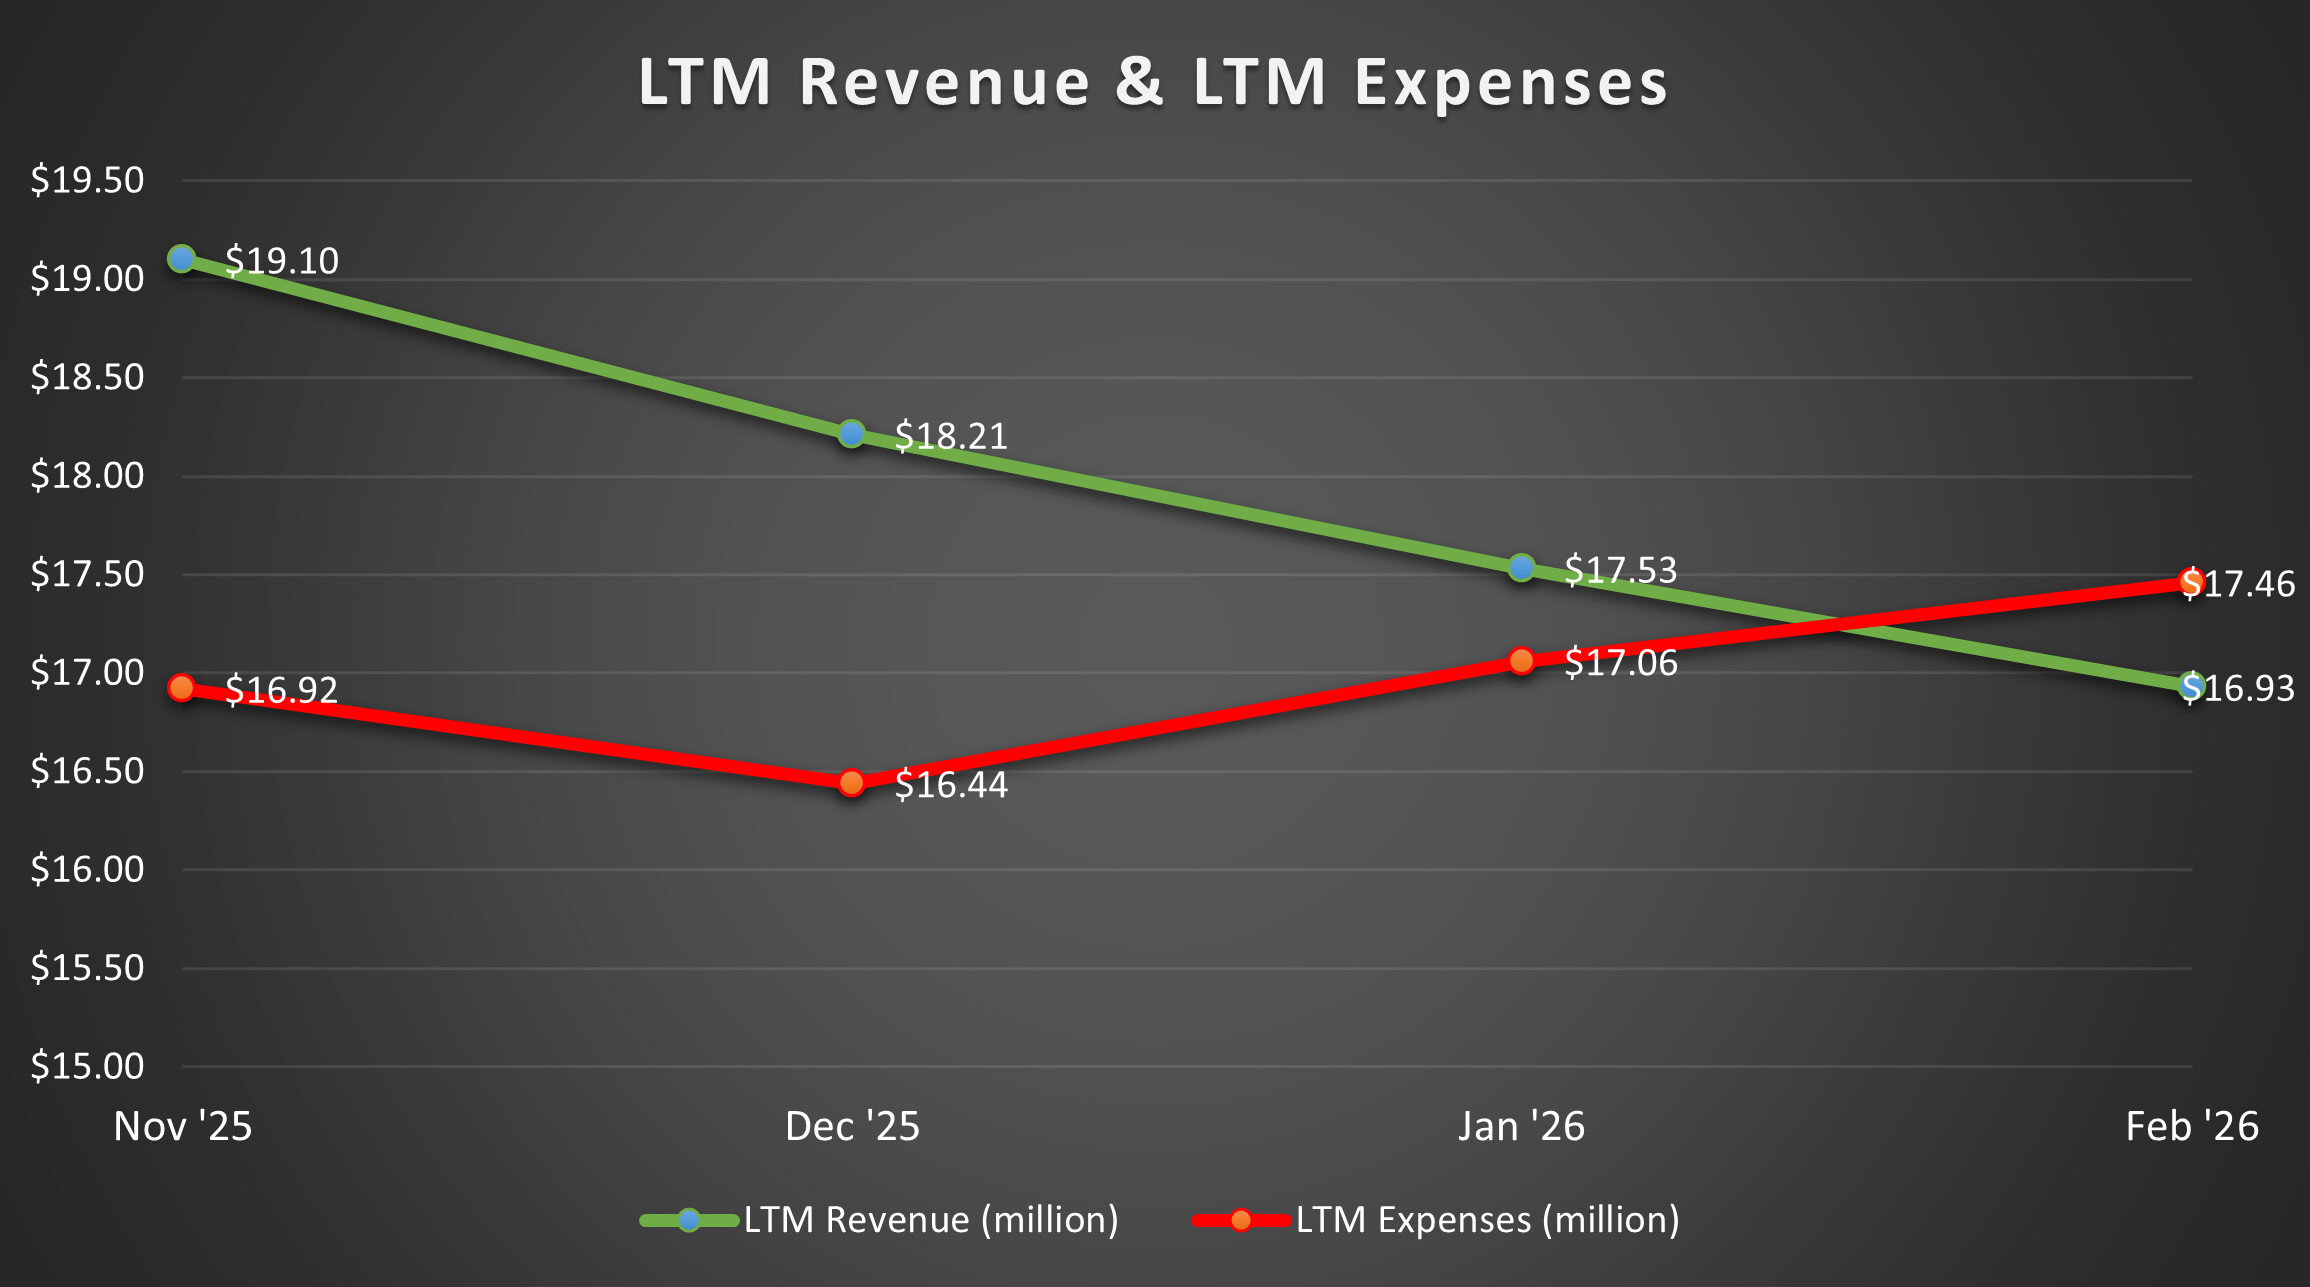
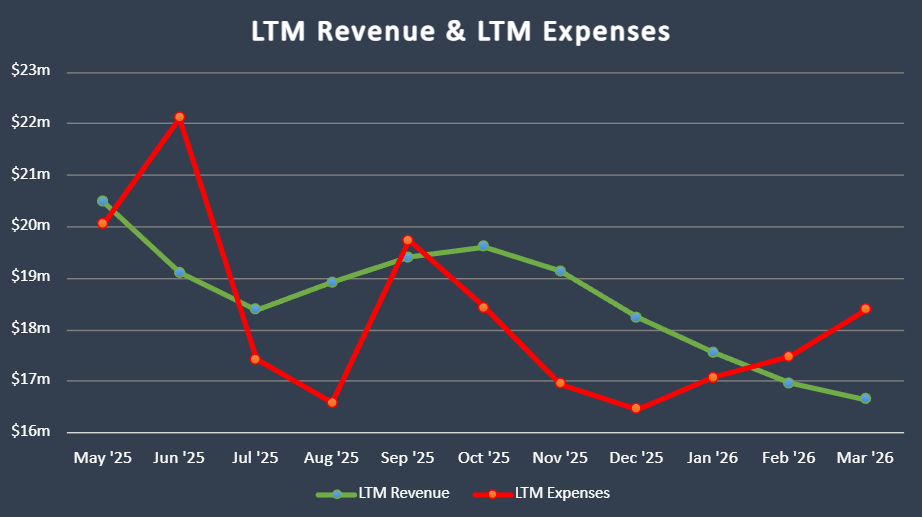
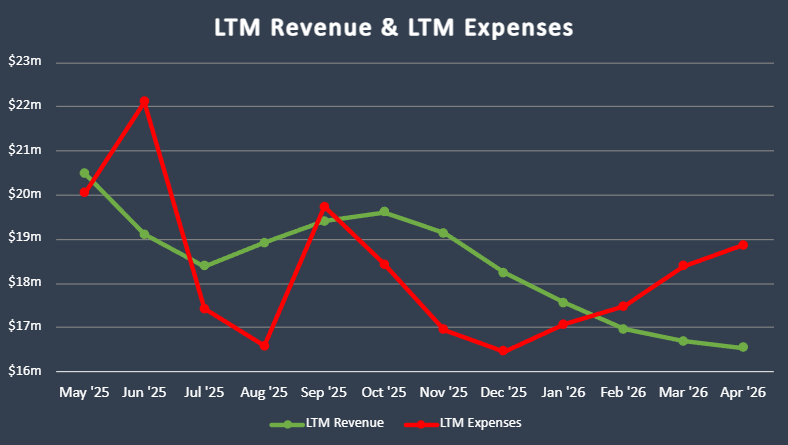
 LTM Revenue vs LTM Expenses ($)
Tracks the operating engine of the protocol. FX, currency effects, and investment P&L are excluded to focus on operating dynamics.
Revenue = registrations + renewals
Expenses = operating costs (excluding FX, currency effects, and investment P&L)
LTM = sum of trailing 12 months
This chart shows structural revenue trends versus cost structure.
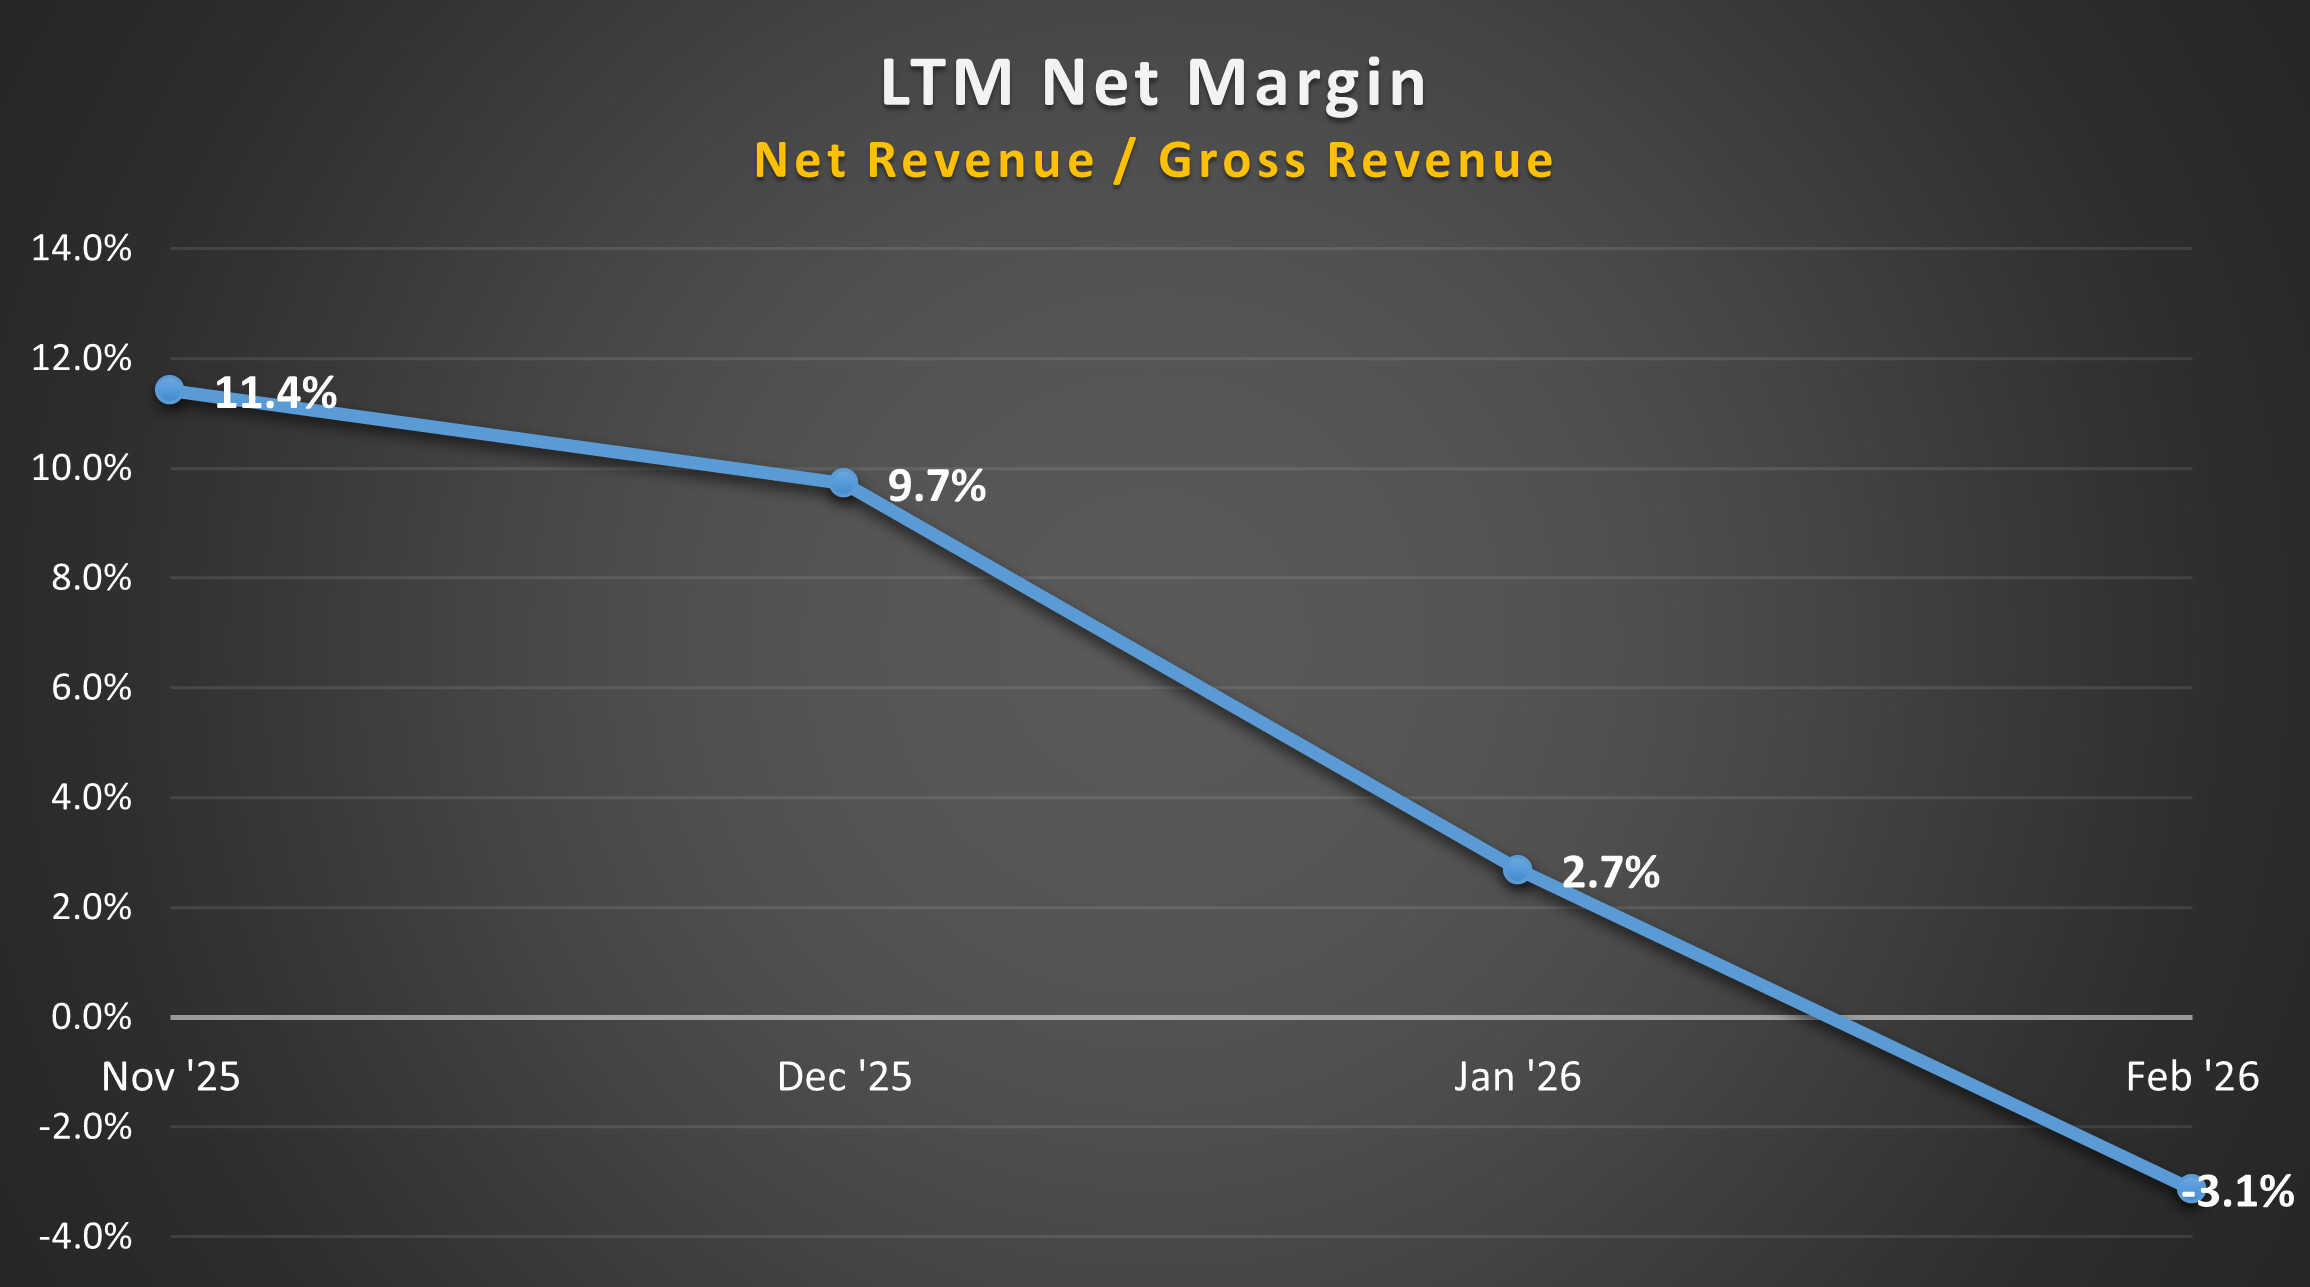
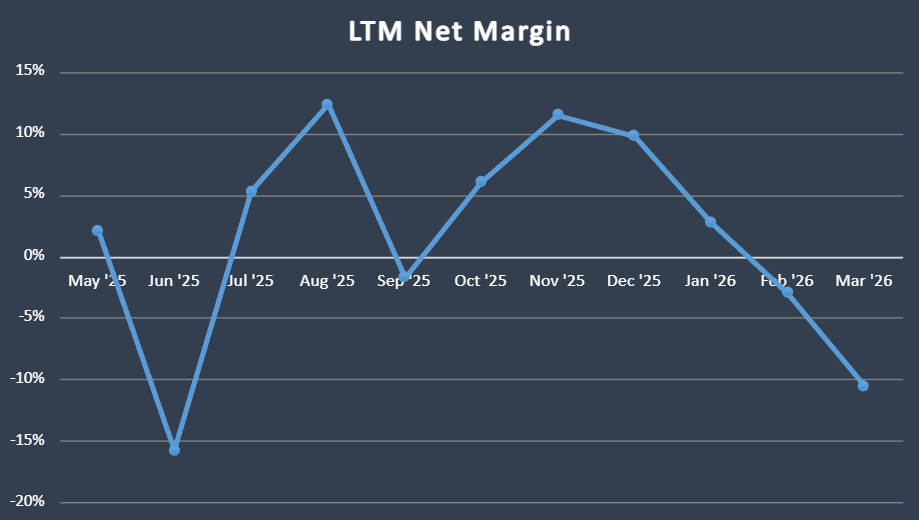
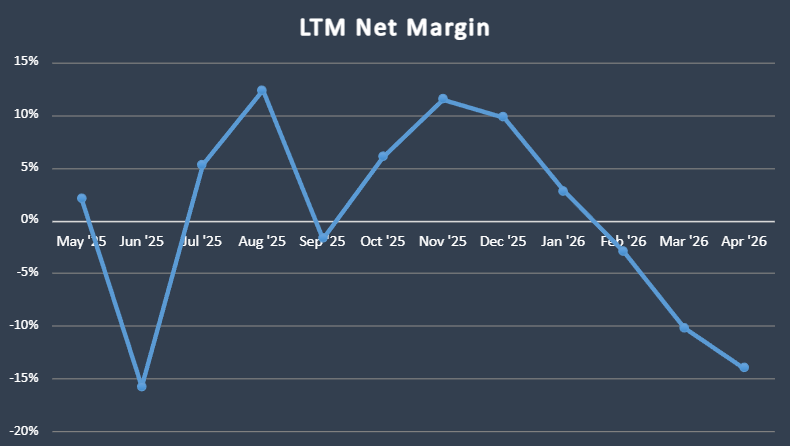
 LTM Net Margin (%)
Defined as: LTM Net Revenue / LTM Revenue
LTM Net Revenue = LTM Revenue - LTM Expenses
This captures fiscal discipline and operating efficiency over time.
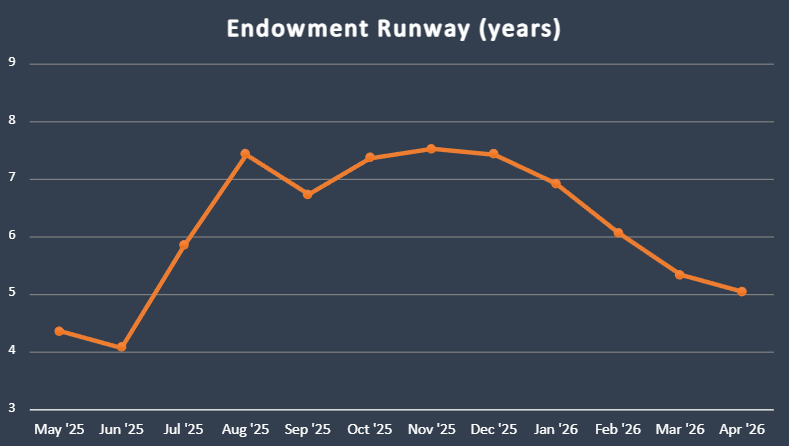
 ENS Endowment Runway (years)
Tracks treasury sustainability relative to the current expense base.
Defined as : ENS Endowment (100D EMA basis) / LTM Expenses
ETH-denominated Endowment components are adjusted using ETH 100-day EMA prices, while stable and other non-ETH components are included at face value.
This chart shows how many years of current LTM operating expenses are covered by the Endowment. It should be interpreted as a treasury sustainability indicator, not a precise liquidation runway.
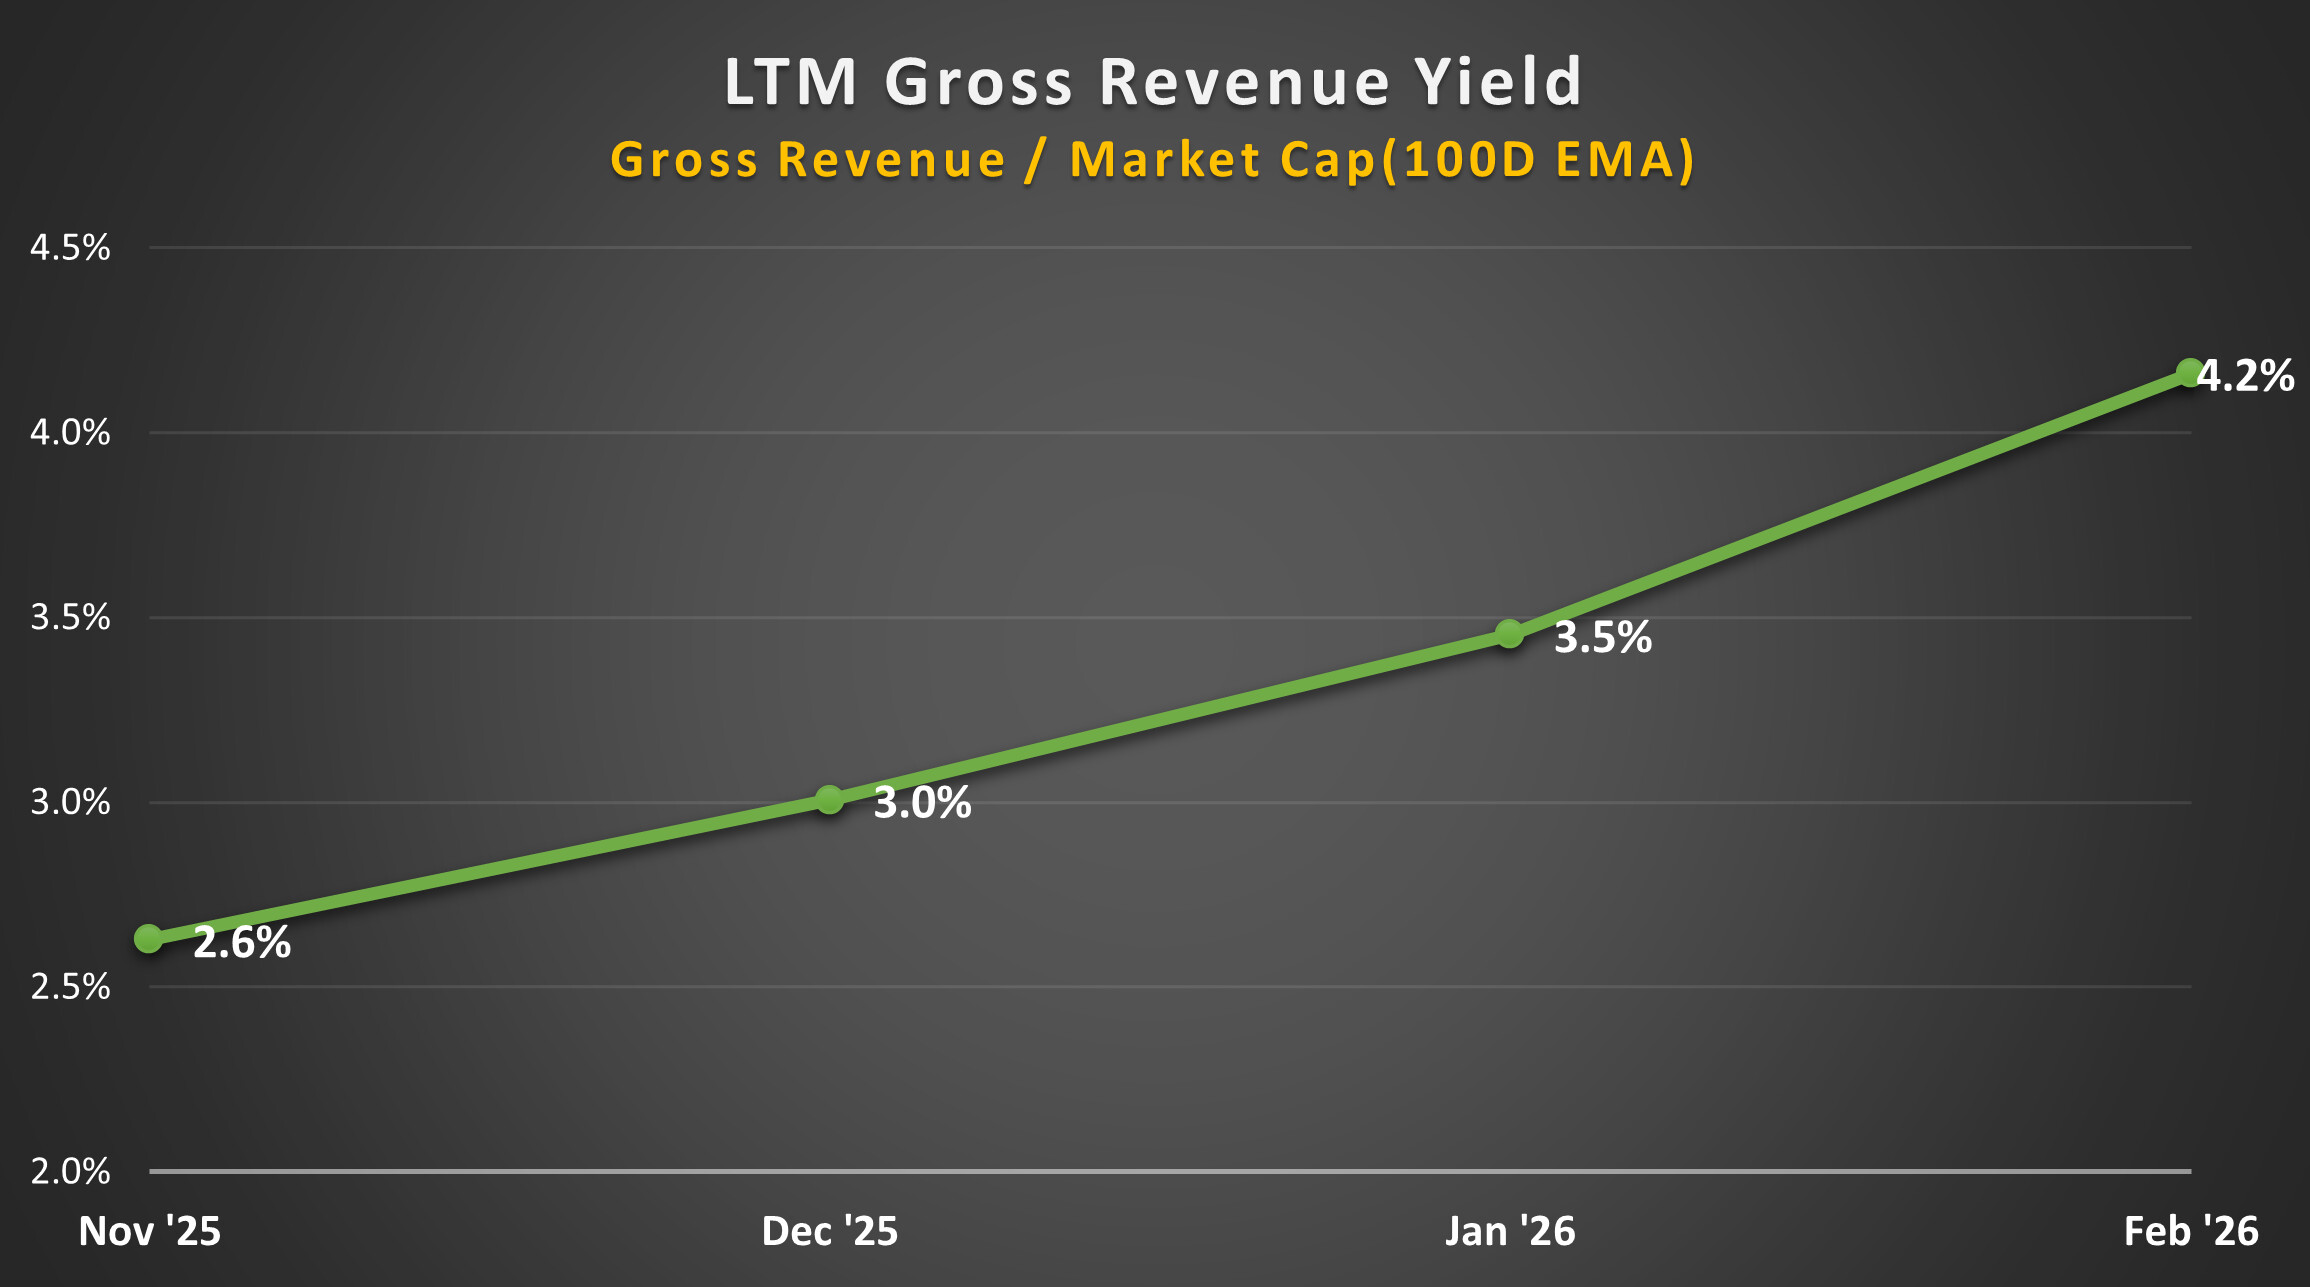
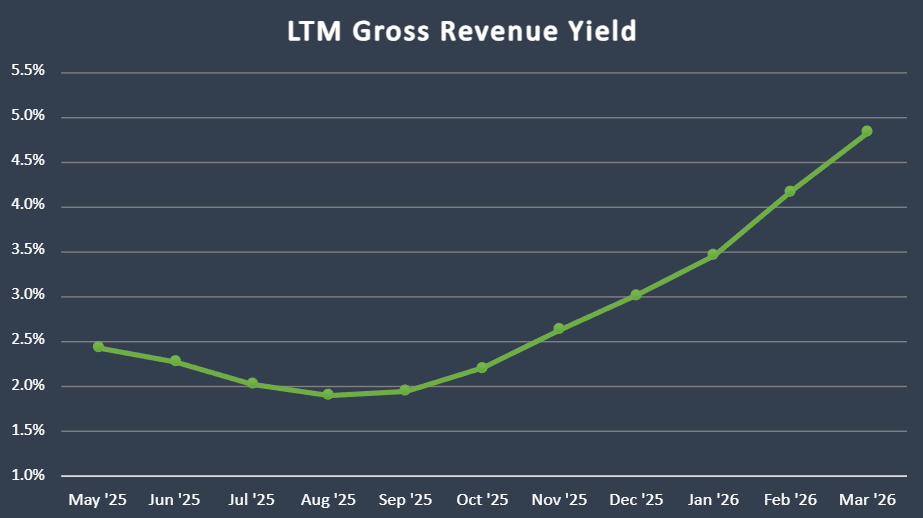
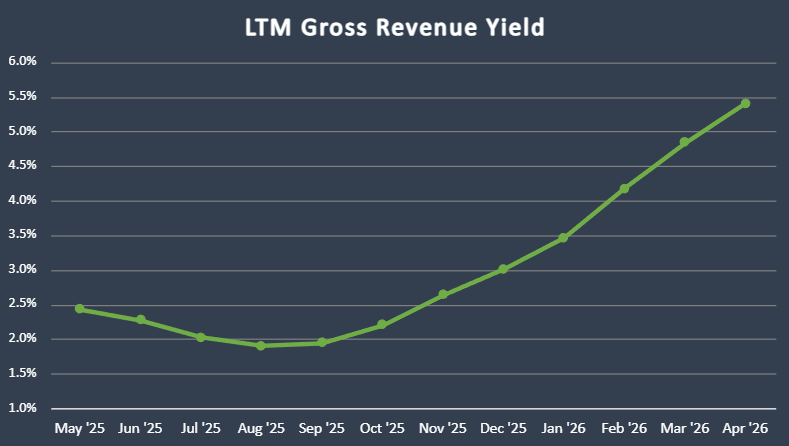
 LTM Gross Revenue Yield (%)
Defined as: LTM Revenue / ENS Market Cap (100-day EMA basis)
ENS market cap is calculated using ENS 100-day EMA price.
This functions as a structural valuation anchor for the token relative to protocol revenue generation.
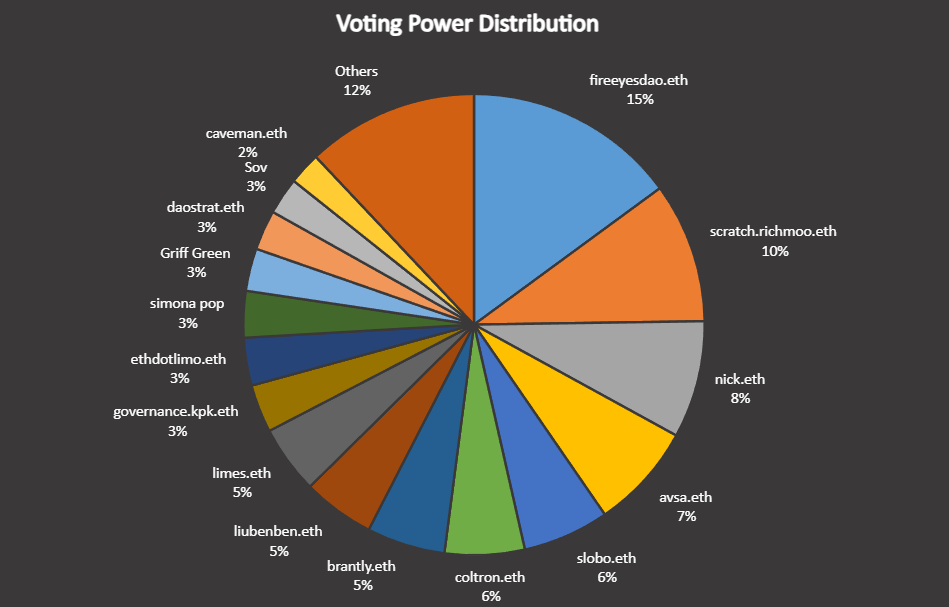
 Voting Power Distribution
Tracks governance decentralization.
Voting Power Distribution is based on the ENS proposal with the highest participation over the trailing three months.
Methodology Notes
LTM = Last Twelve Months.
Revenue, Expenses, and Endowment data are sourced from dune.com/steakhouse/ens-steakhouse.
Token supply includes all supply except DAO controlled portion. ENS tokens held by ENS Labs are also included, as they are not under DAO control.
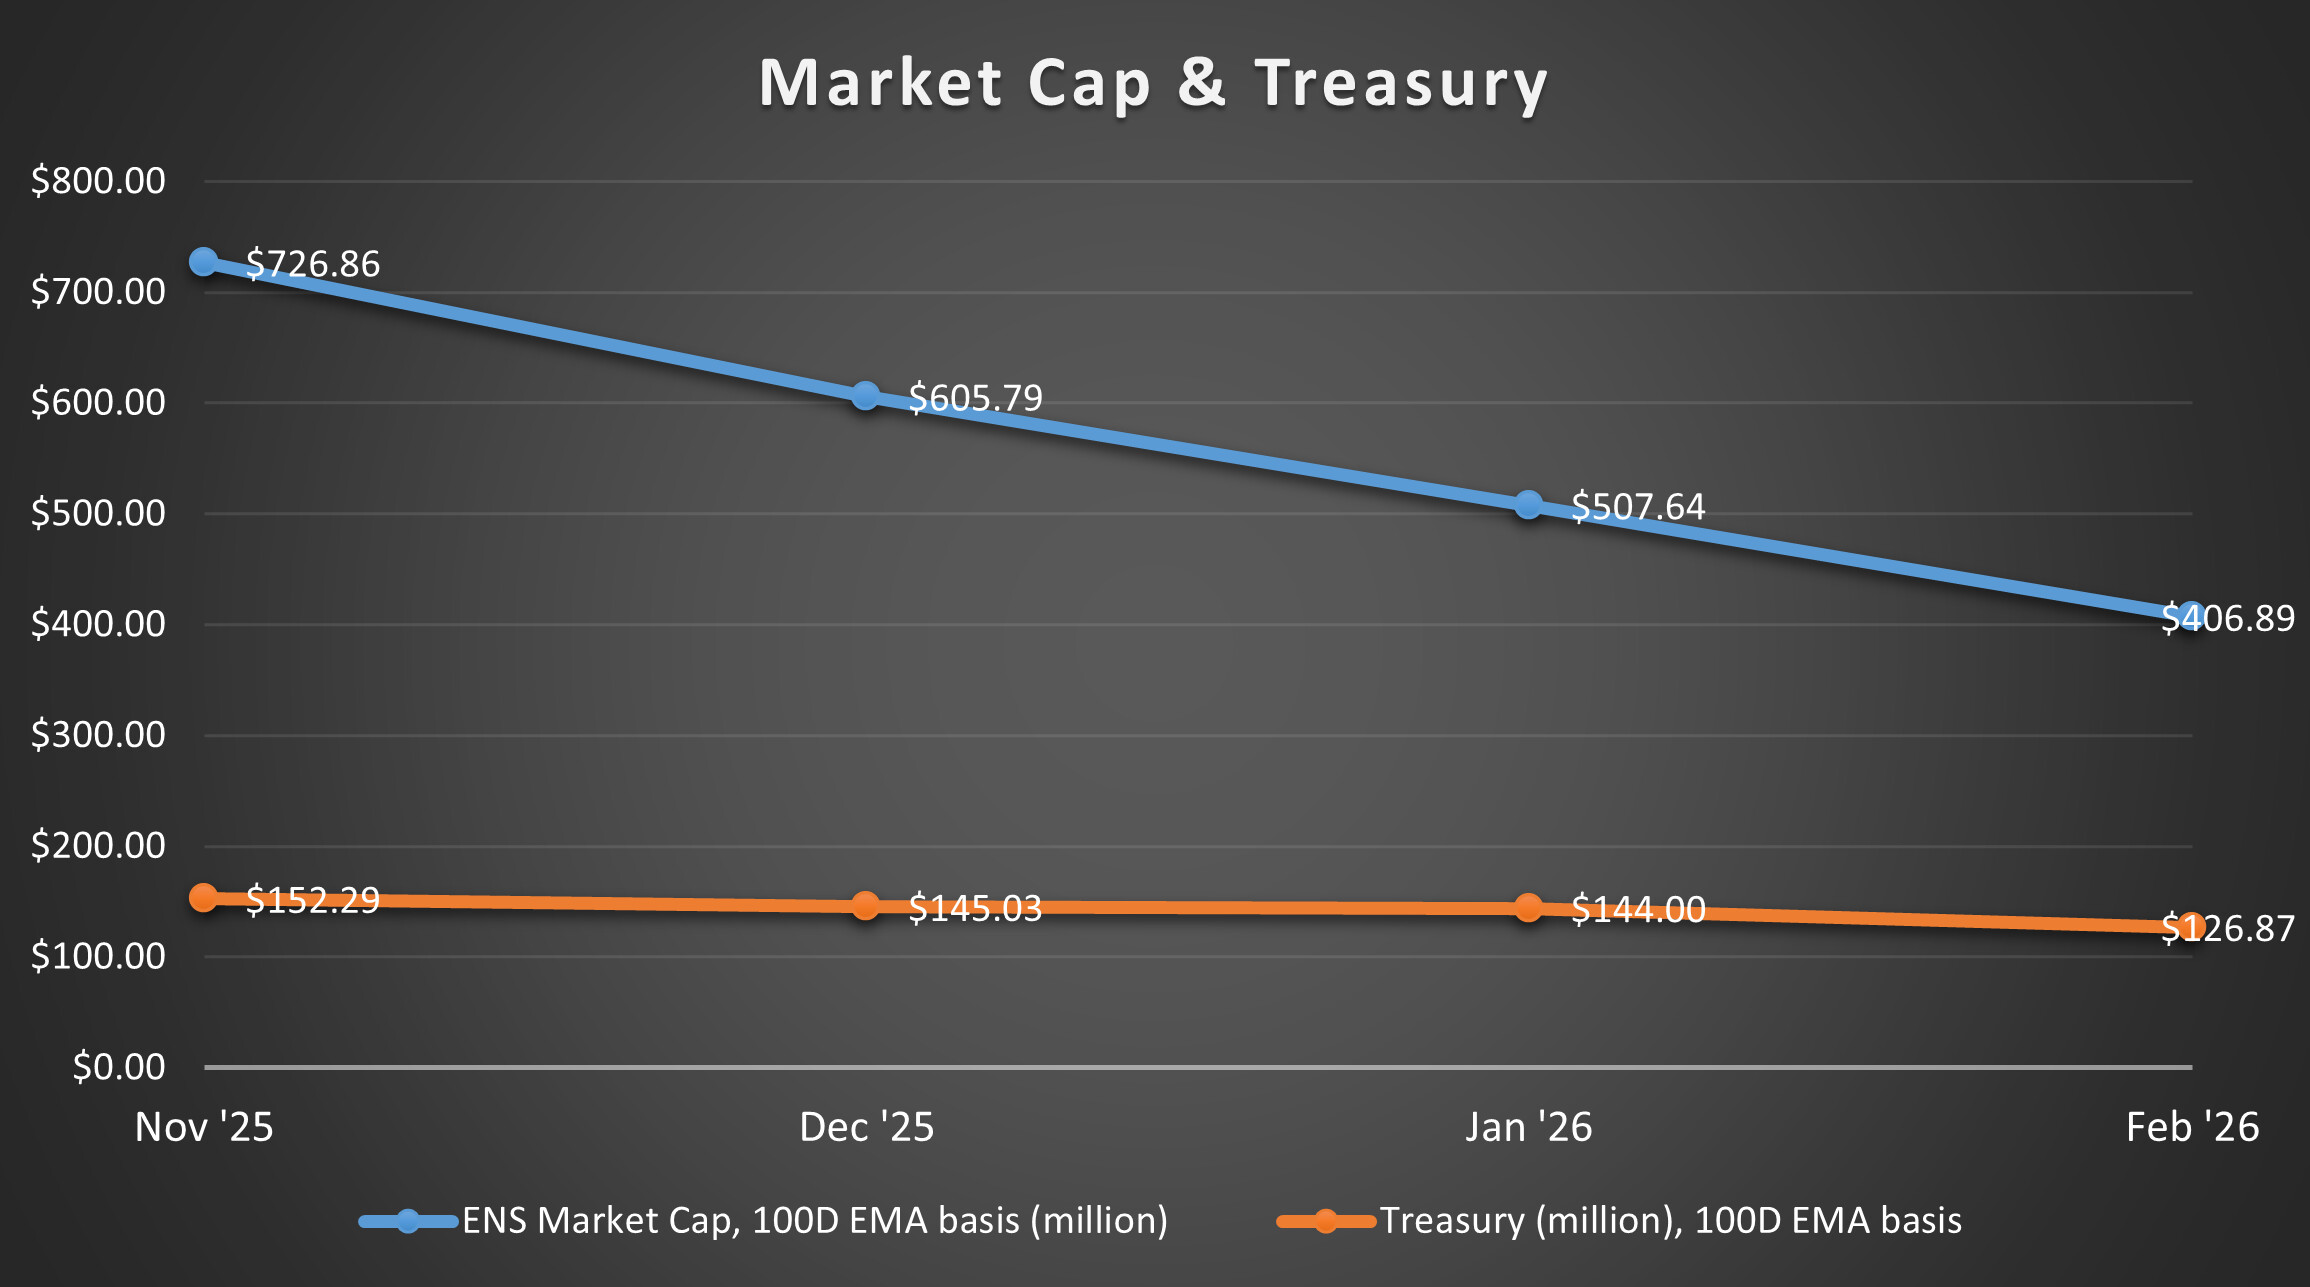
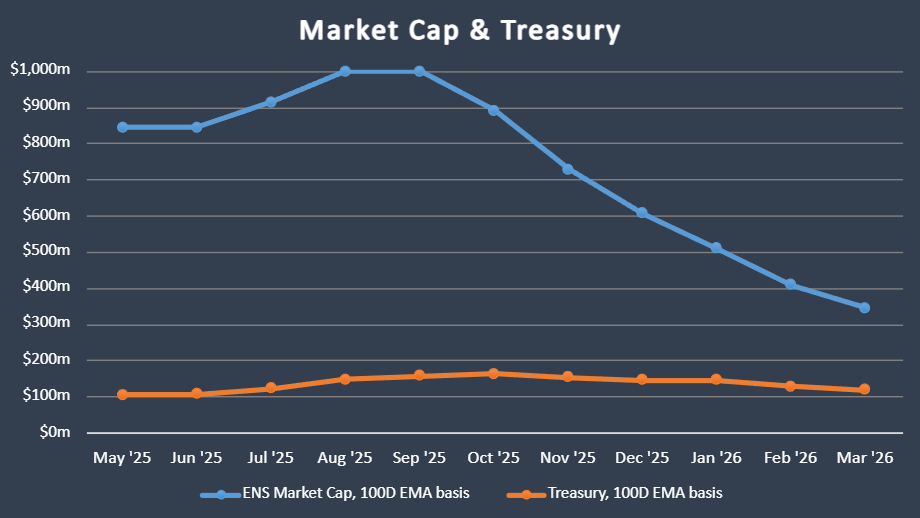
Beginning with the April 2026 update, the previous Market Cap vs Treasury chart has been replaced with Endowment Runway.
This thread will be updated at each month-end with refreshed charts.