This thread tracks ENS protocol fundamentals using four core indicators on a Last Twelve Months (LTM) basis.
The objective is to monitor:
-
Operating performance
-
Fiscal discipline
-
Valuation relative to revenue
-
Treasury strength
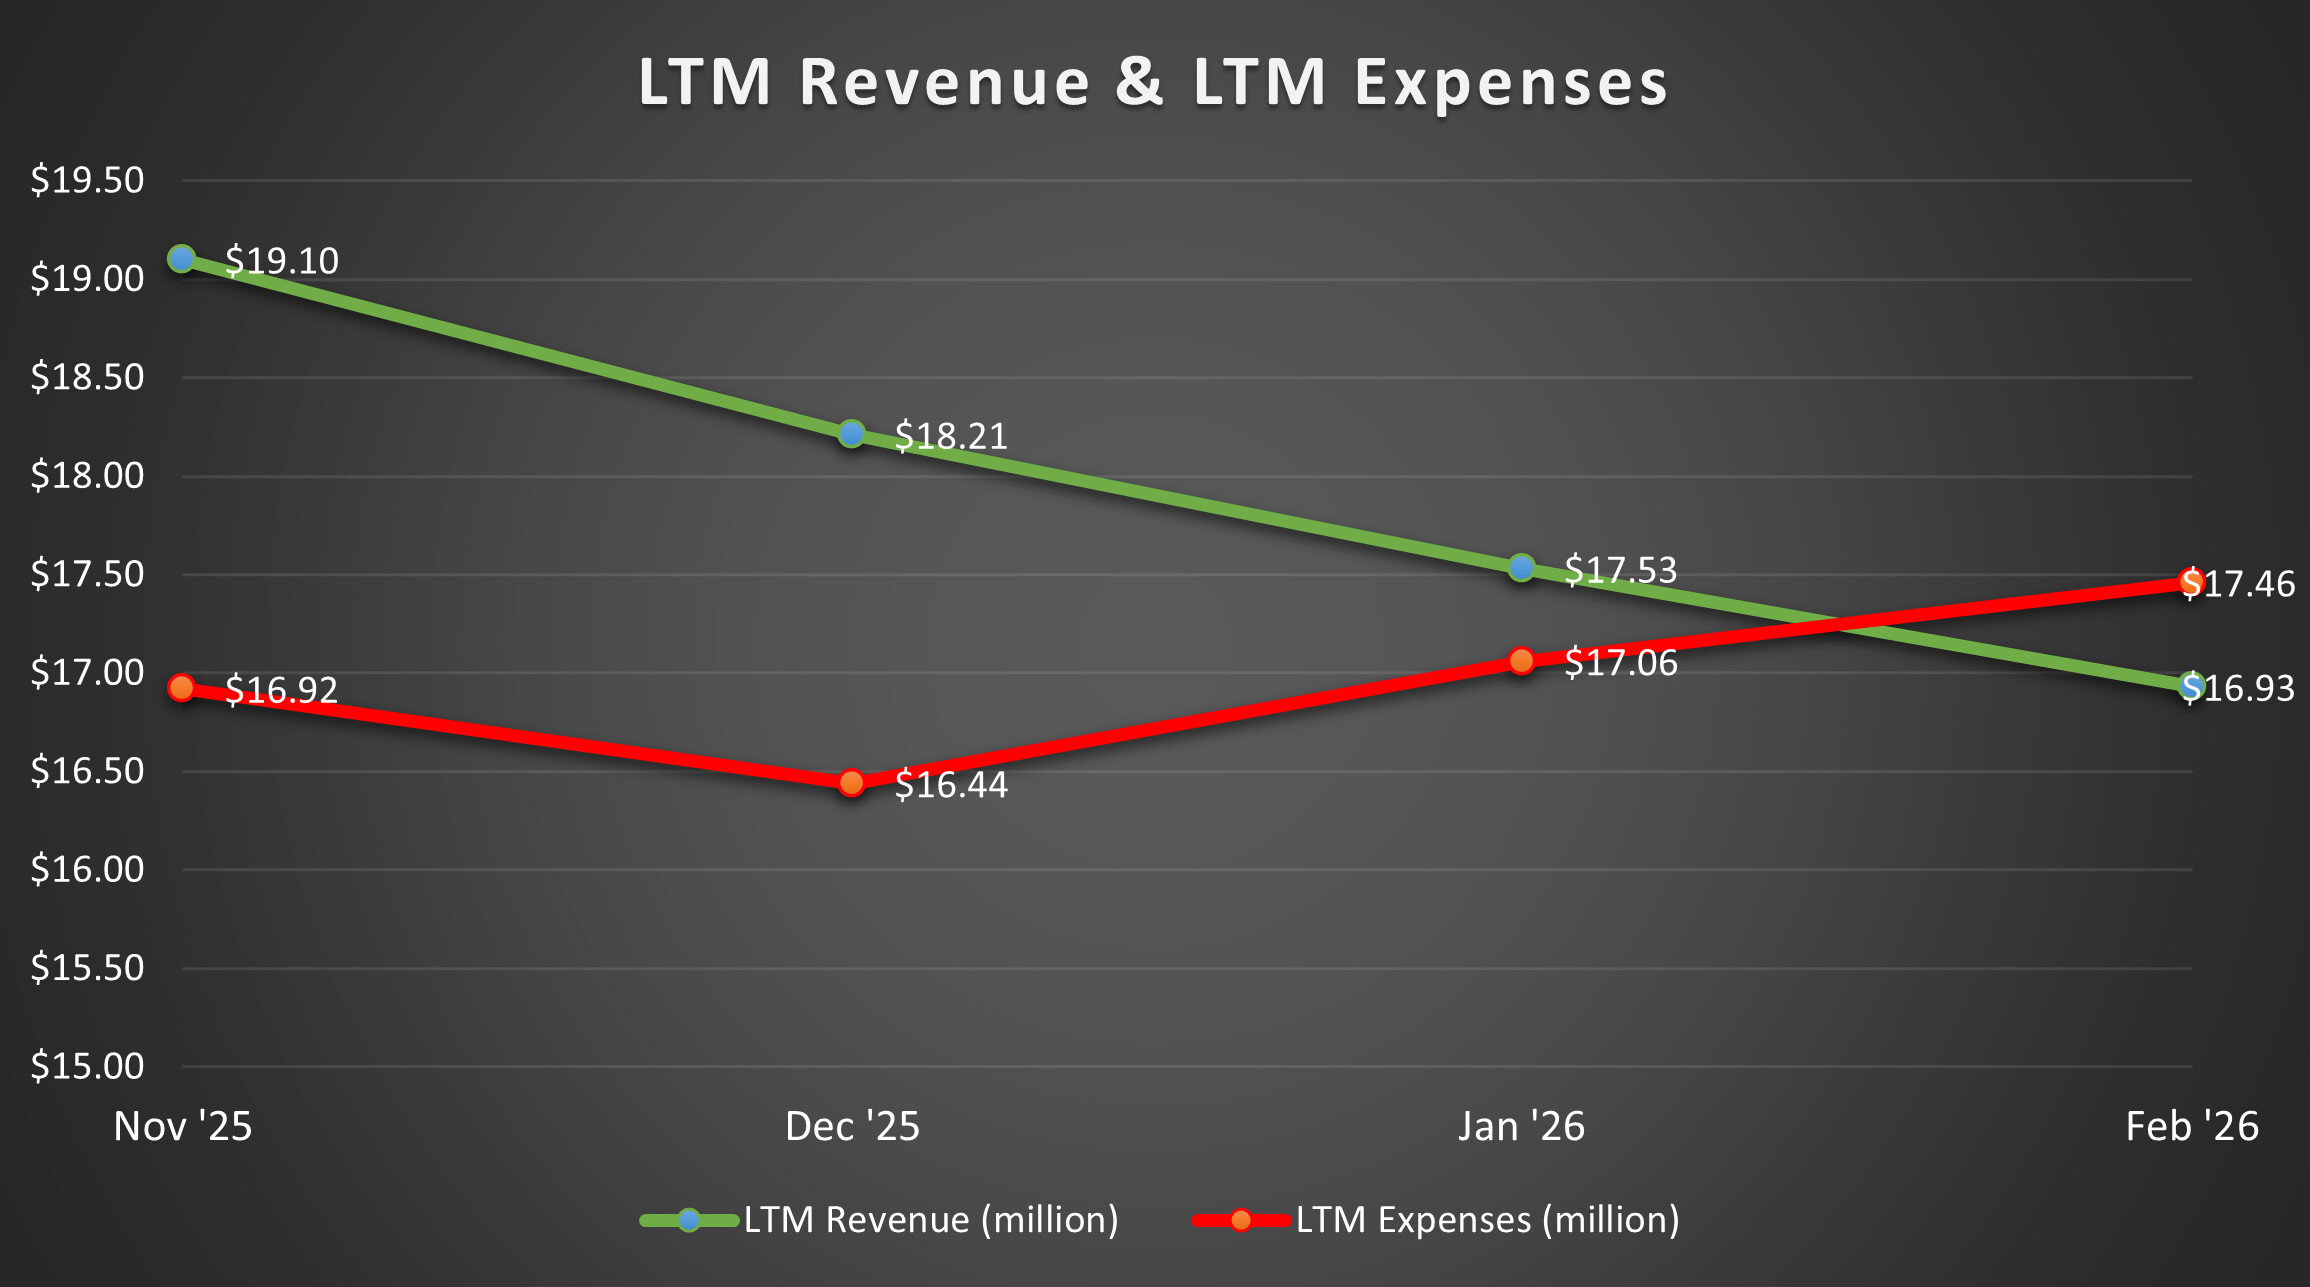
 LTM Revenue vs LTM Expenses
Tracks the operating engine of the protocol.
-
Revenue = registrations + renewals
-
Expenses = operating costs (excluding FX, currency effects, and investment P&L)
-
LTM basis smooths monthly volatility
This chart shows structural revenue trends versus cost structure.
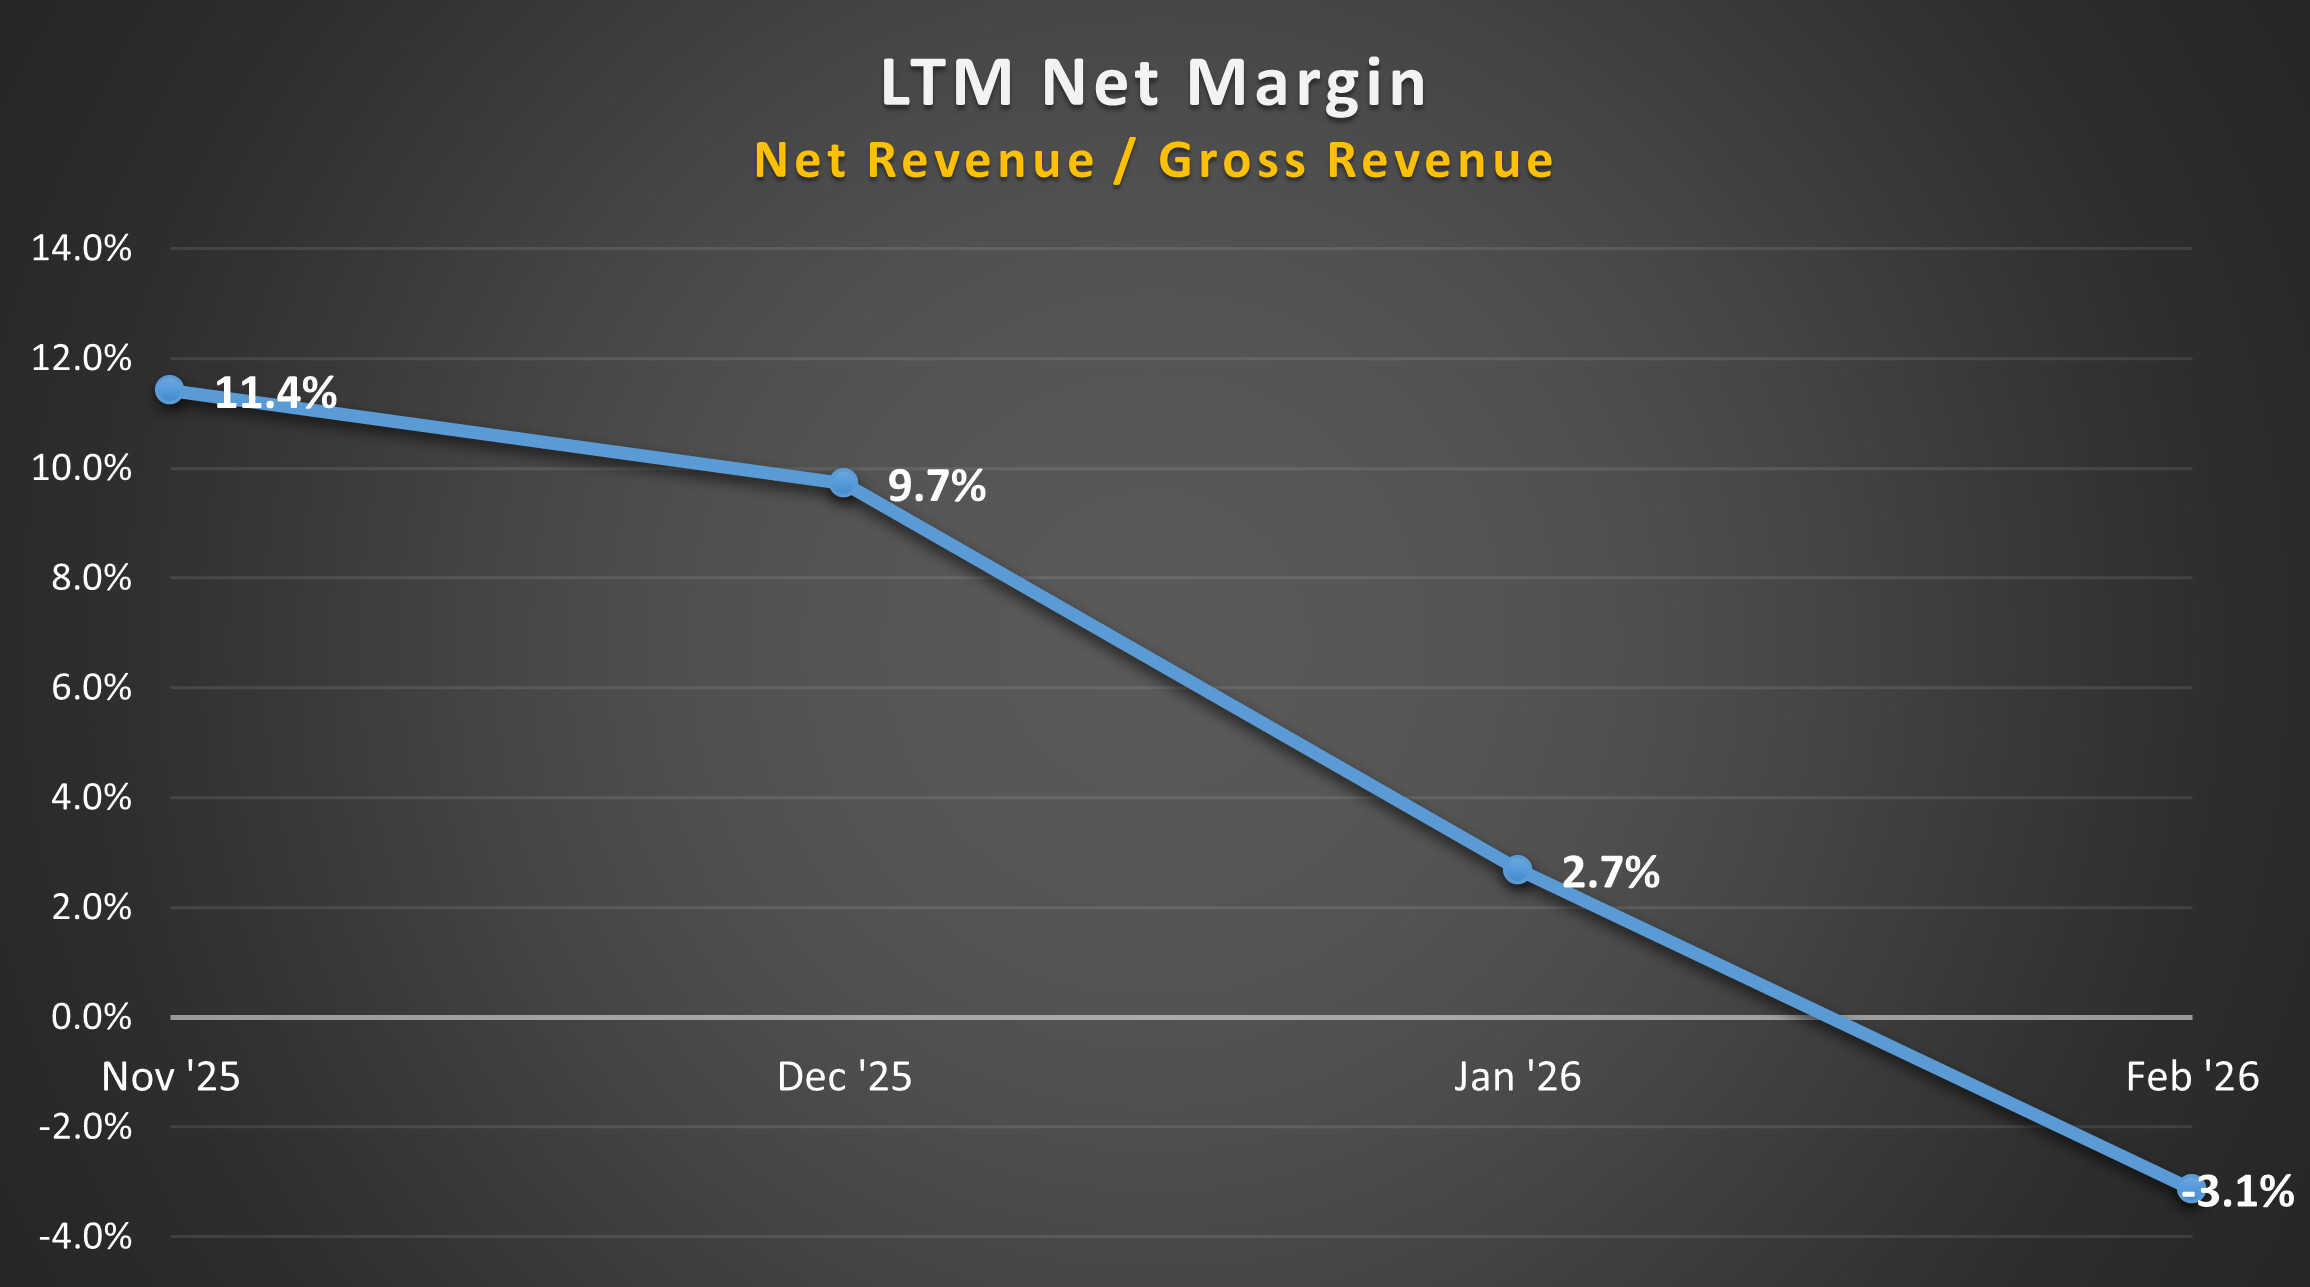
 LTM Net Margin (%)
Defined as: Net Revenue / Gross Revenue
This captures fiscal discipline and operating efficiency over time.
LTM basis avoids short-term noise.
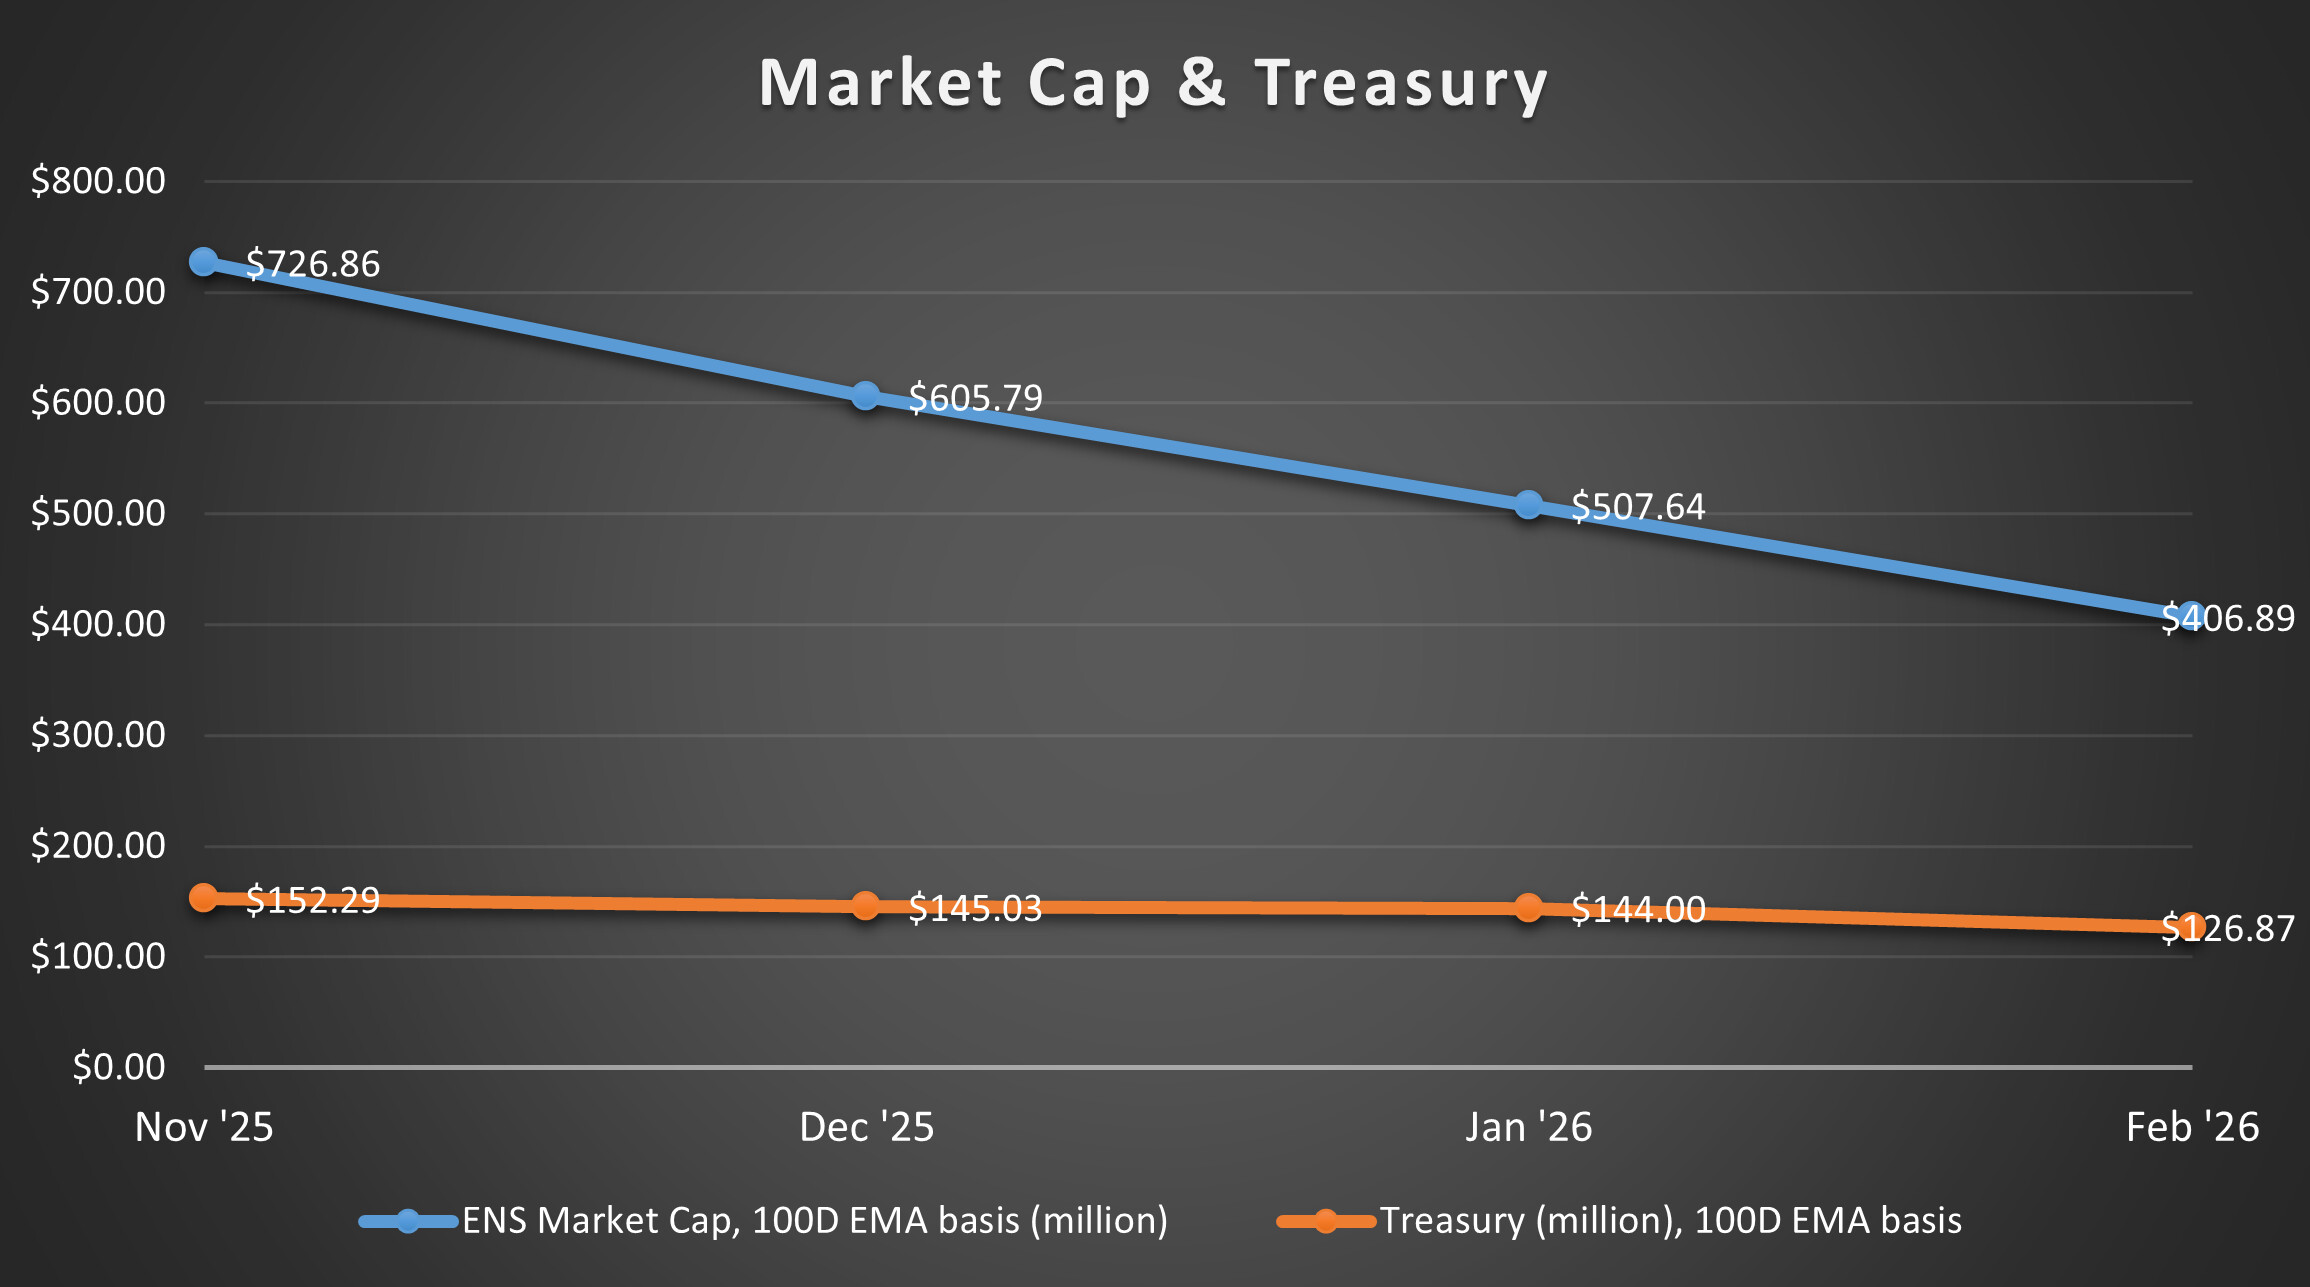
 ENS Market Cap vs Treasury
-
ENS market cap calculated using 100-day EMA price
-
Treasury valued using 100-day EMA ETH price
-
Treasury assumed composition: ~60% ETH / ~40% stables
EMA pricing is used to reduce short-term volatility and better reflect structural valuation trends.
This chart compares speculative valuation vs asset backing.
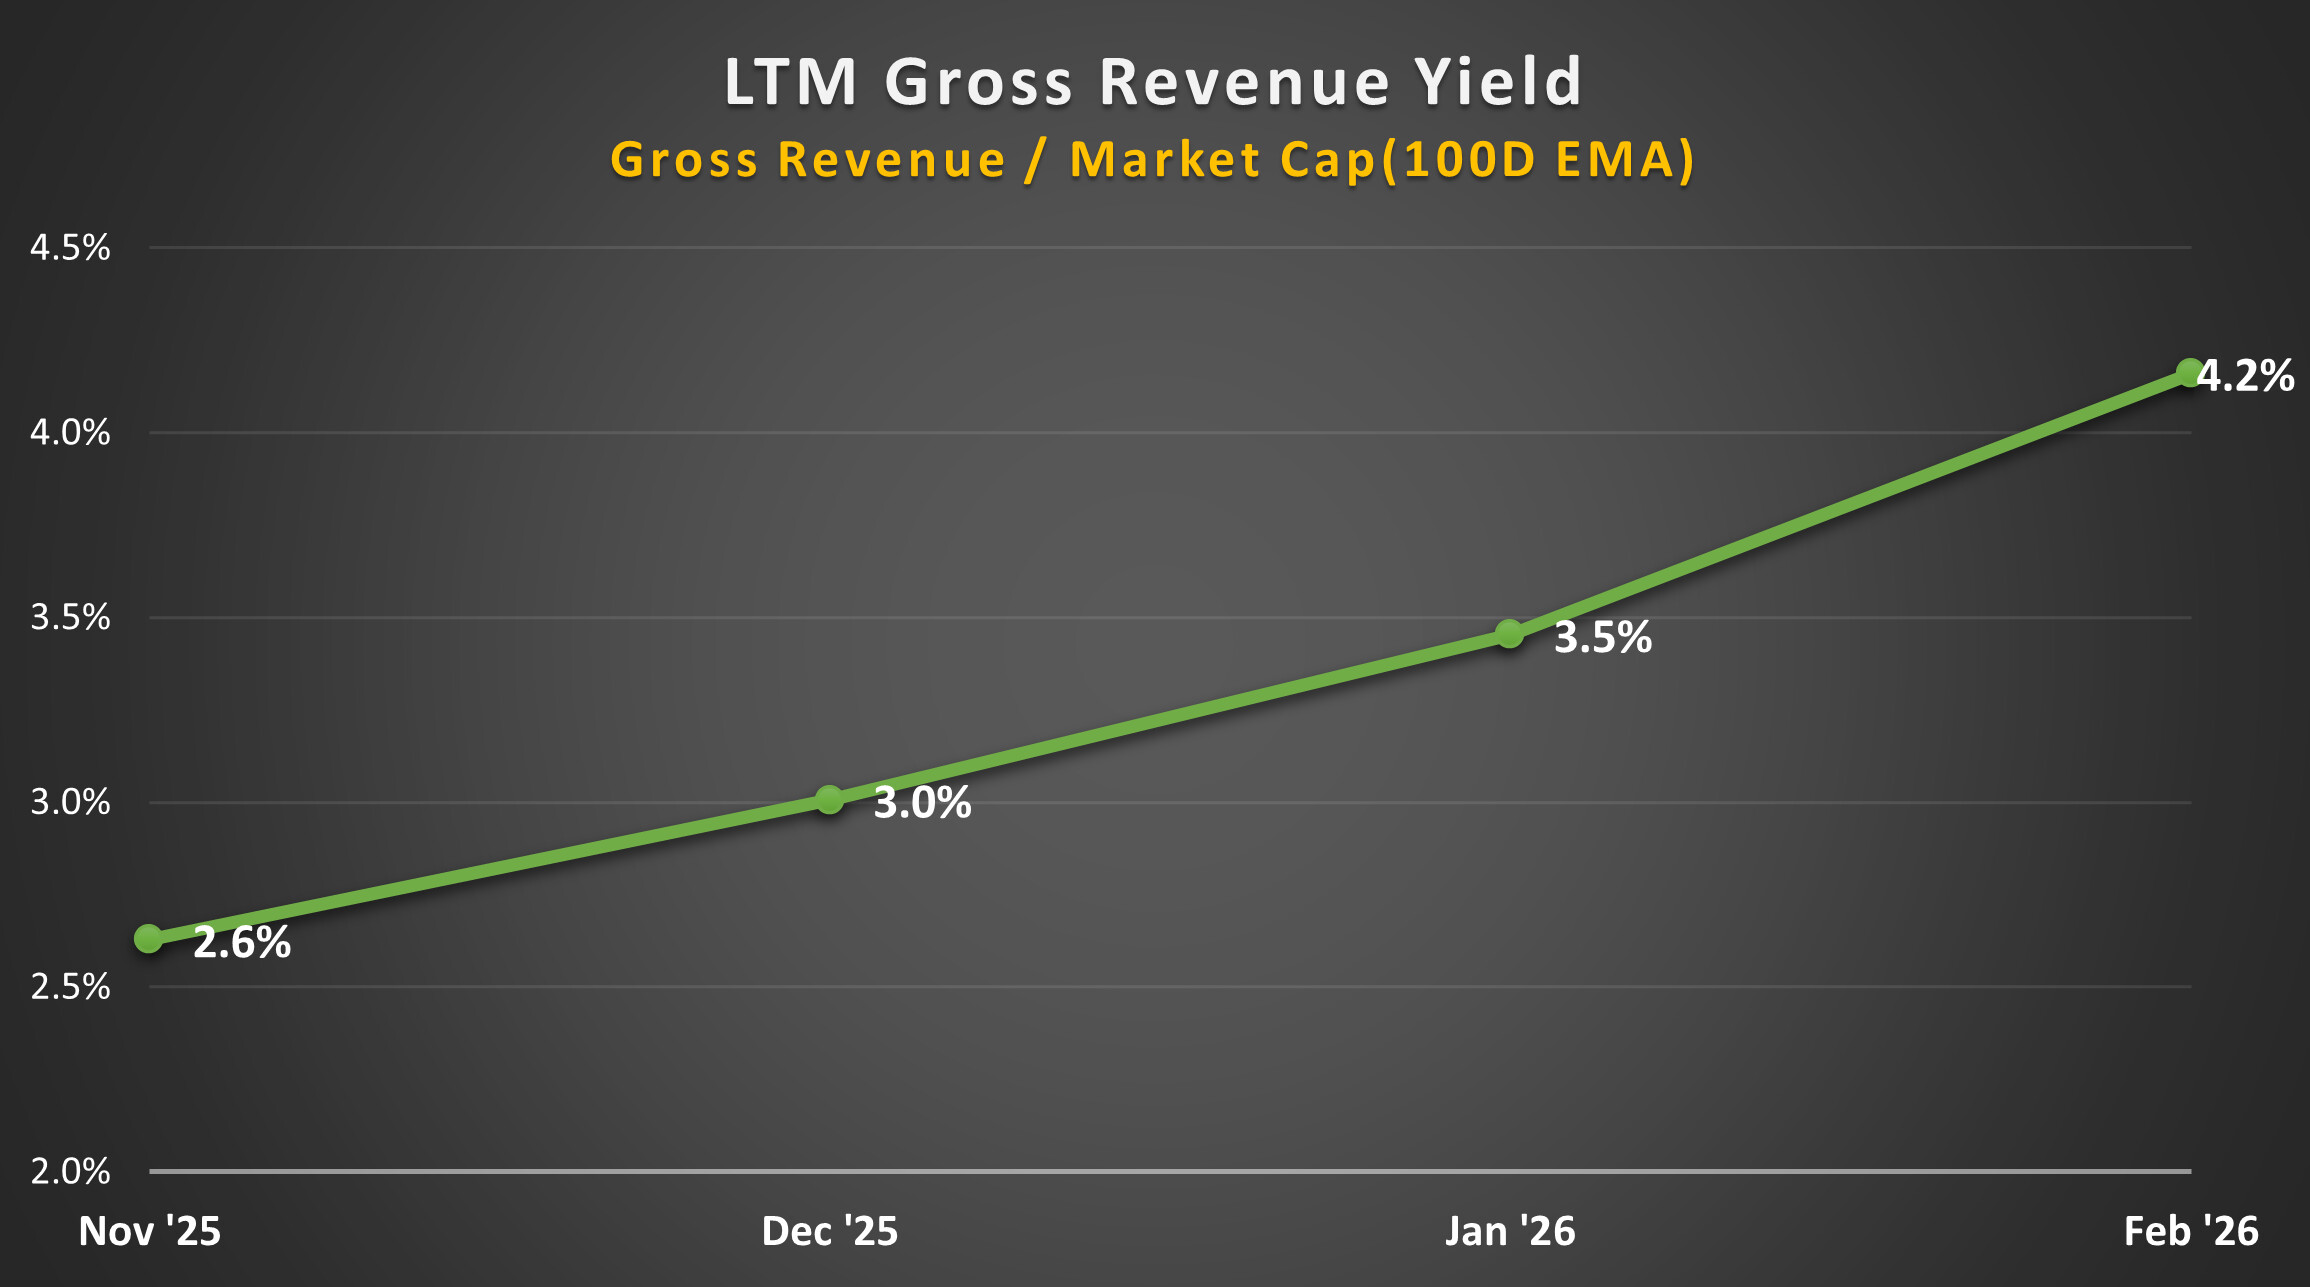
 LTM Gross Revenue Yield (%)
Defined as: LTM Revenue / ENS Market Cap (100-day EMA basis)
This functions as a structural valuation anchor for the token relative to protocol revenue generation.
Methodology Notes
-
LTM = Last Twelve Months.
-
Revenue data sourced from dune.com/steakhouse/ens-steakhouse
-
All figures reflect month-end values.
-
FX, currency effects, and investment P&L are excluded to focus on operating dynamics.
-
ENS market cap and ETH in treasury are calculated using 100-day EMA prices to reduce short-term volatility and better reflect structural valuation trends.
-
Circulating supply includes ENS tokens held by ENS Labs, as they are not under direct DAO treasury control.
This thread will be updated at each month-end with refreshed charts.