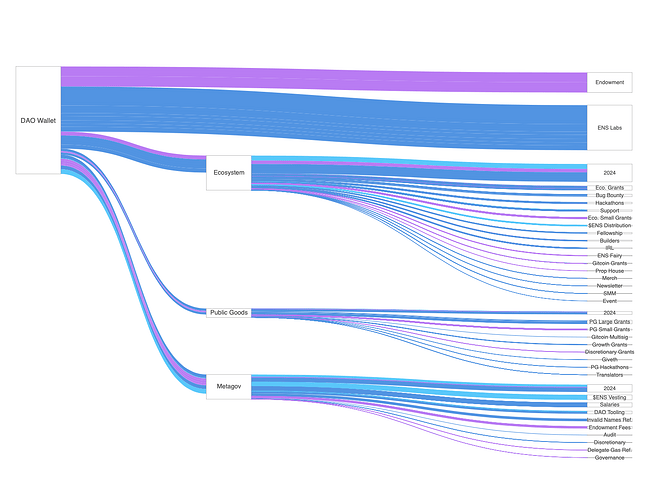
@AvsA and I built the ENS Open Ledger, a platform designed to track and visualize DAO budgets, providing an intuitive understanding of fund allocation across various working group expenses through an interactive Sankey diagram. The platform enhances transparency and detail, making it a valuable tool for informed decision-making, monitoring your own funding, and analyzing your competitors within the DAO ecosystem. The application is availible at ens-ledger.app.
The app is open-source, the code is available on GitHub.
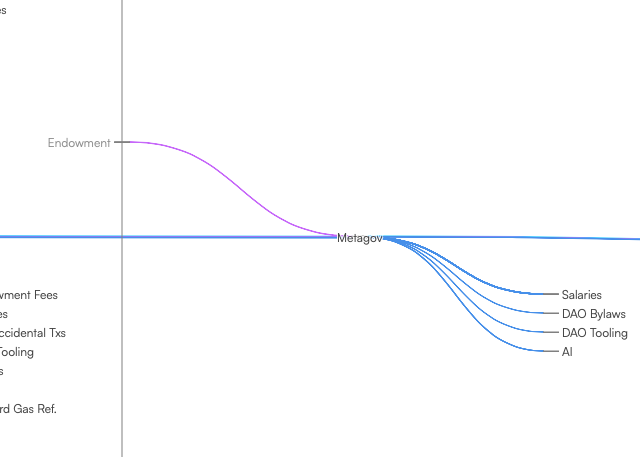
The nodes in the diagram are the DAO Wallet, the working groups (including their main and subgroup wallets), and the spending items associated with the working groups. The links in the graph represent transactions between these wallets. The width of a link corresponds to the amount transferred, expressed in USD at the time of the transaction.
Timeframe
You can explore the All-time version of the graph, which displays ENS transactions from the formation of the DAO up to the present, organized by quarters. If you observe a wallet sending funds to itself in the next quarter, this indicates the funds were unspent and carried over. In this view, the scale of DAO Wallet transfers might be so significant that other links may appear too narrow for an intuitive understanding. You can hide these transfers using the “Hide DAO Wallet and Endowment” toggle button.
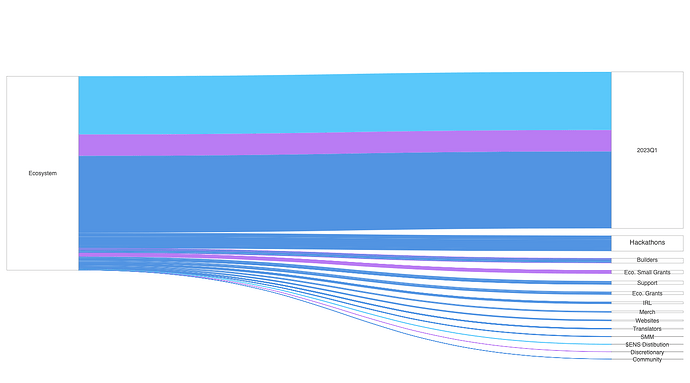
You can filter data by quarter or year by clicking on the relevant annotation at the top of the All-time diagram. This allows the chart to focus on transactions from the selected period. E.g. Chart for 2023:
Interactions
Each chart is interactive:
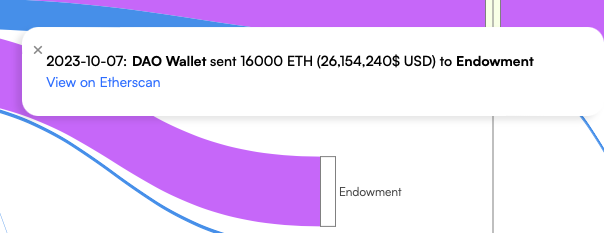
Clicking on a link reveals a summary of the transaction and a link to Etherscan.
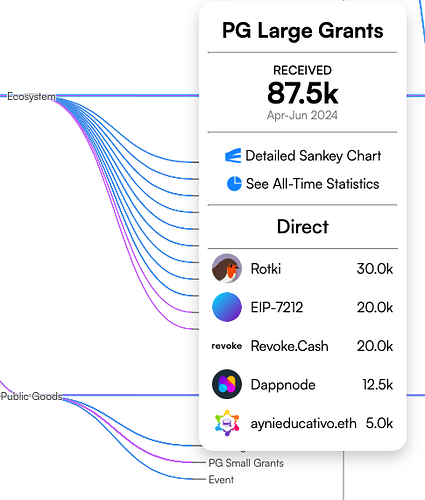
Clicking on a node (if it’s a working group expense item) opens a dropdown containing a summary, a list of final recipients within the category, and options for more details.
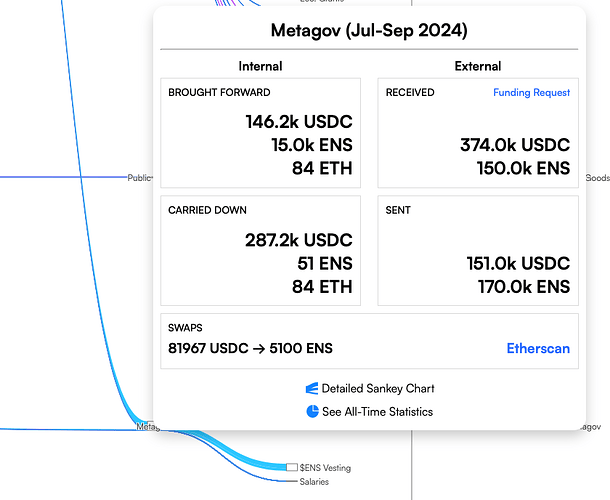
Clicking on a working group node displays a summary of funds received, spent, carried forward, and any swaps. If the working group received funds from the DAO Wallet, there will be a corresponding link to the Funding Request. If there was a Spending Summary for the reporting period, there will be a link to it. Detail options are also available.
Detailed Charts
By clicking on the “Detailed Sankey Chart” button, you can visualize any chart, whether for a working group (e.g. Ecosystem in Q4 2022):
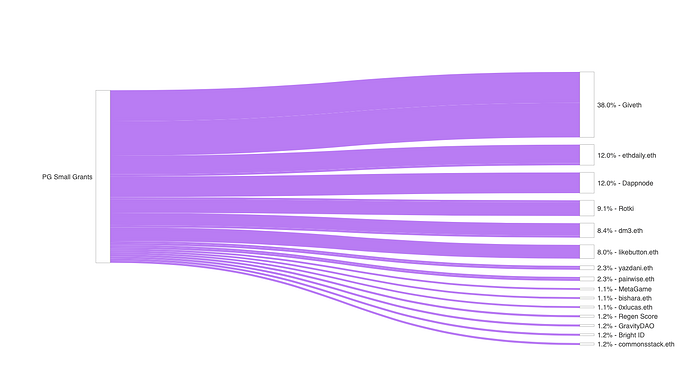
…or an expense category (e.g. Public Goods Small Grants in Q4 2023):
Detailed Statistics
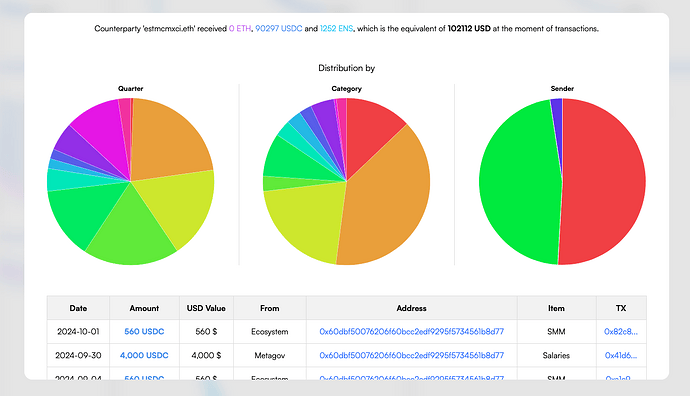
By clicking on the “All-time Statistics” button or selecting a final recipient in the dropdown, you can access a modal with detailed statistics for the selected working group, category, or recipient.
Data
The chart data is automatically collected from the chain every two hours. The identification of final recipients and the relevant expense categories is done manually. If a transaction is unidentified, it appears in a table accessible by clicking on the “Identify Transactions” button. If you know the final recipient and the reason for the ENS payment, you can fill in the fields to assist. Payment assignments in the historical data were based on working group reports and have been thoroughly reviewed, but errors may still occur. If you find one, please inform us.
Export
You can download any chart in graphical or tabular format by clicking the corresponding button.
Future Development of the Project
There are numerous areas for improvement in the application. Future development will be conducted with the approval and oversight of the Metagov WG. If you have ideas for enhancements, feel free to contribute.
