Six months after the last distribution of vesting contracts, we see a less than positive picture.
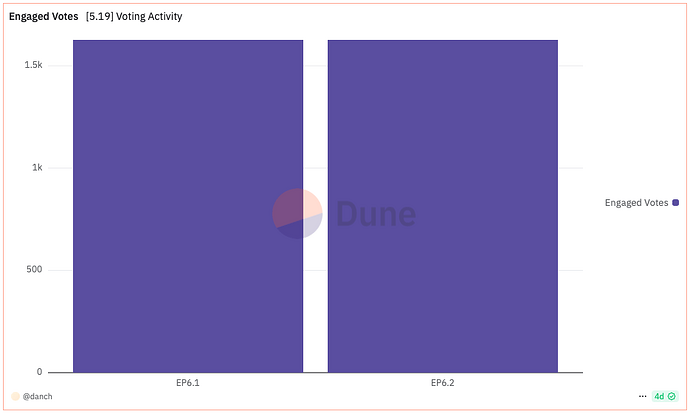
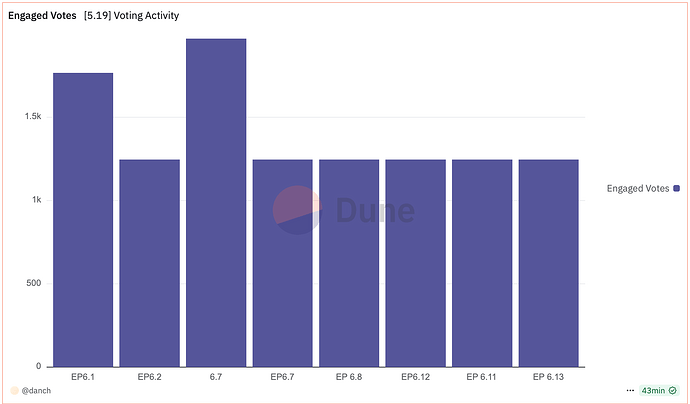
A total of 3,700 tokens out of 25,300 were delegated. Even fewer participate in executable votes – about 1,200 votes in the last 5 proposals:
However, I would not draw conclusions about the failure of the initiative, since only 2,080 tokens out of 11,000 available for withdrawal as of September 10 were claimed. In total, there are unfrozen and available for movement tokens equivalent to 205 thousand dollars on vesting contracts.
A total of 26 individuals/organizations out of 98 recipients (26%) of this distribution delegated or claimed their tokens. Basically, these are those who are close to the DAO and are exactly aware of what is happening in it.
This makes me think that while Marcus (@estmcmxci) did a great job of publicizing this distribution via DAO twitter posts and a guide, it went unnoticed by most recipients (since they probably don’t follow DAO twitter).
What do you think needs to be done to notify all recipients? Is it appropriate to reach out to all of them directly with information about the initiative and a guide on how to manage the contract?


